Posts written by Thomas Lumley (2645)

avatar

Thomas Lumley (@tslumley) is Professor of Biostatistics at the University of Auckland. His research interests include semiparametric models, survey sampling, statistical computing, foundations of statistics, and whatever methodological problems his medical collaborators come up with. He also blogs at Biased and Inefficient

August 29, 2020

Be a lert but not alarmed

Auckland is going back to level 2 (God willing and the creek don’t rise) on Monday.  Together with my local circle of health and stats nerds, I’m viewing this with some concern. It hasn’t been very long since we had a case show up with no previously known contact to the cluster. Like, Tuesday.  It’s quite possible there are still a few other people in the cluster who haven’t been found yet.

The concern is not that it will actually be dangerous on Monday to be going to work or going shopping. The number of undetected cases will be small; your chance of getting infected on Monday is tiny.  The problem is, as long as there are undetected, infectious cases, your chance of getting infected on Tuesday is very slightly higher. And slightly higher again on Wednesday, and so on in exponential increase. Eventually, it may get dangerous, and  stopping it then is much more costly in health and freedom and money.  In Victoria today they are talking  about the psychological boost of getting a day with less than 100 new cases. If we’re careful and lucky, the current testing and tracing will be enough to stop this cluster exploding; if we’re not, maybe not.

One challenge in COVID risk communication is that the risk is longer-term and social, not immediate and individual. It’s important that as many  people as possible take precautions against spreading the virus: distancing, masks, getting tested if you have symptoms, working from home if that’s feasible, avoiding places with poor ventilation. But it’s not so much important for your or your family’s immediate safety: the risk is currently very low. If someone jogs past you at close range without a mask or stands a bit too close in  a supermarket line, you don’t need to panic — you almost certainly won’t catch the coronavirus. On the other hand, the more people behave that way, the more chance that they outbreak will slowly get out of control.  The appropriate level of care is a lot higher than the appropriate level of fear.

Ideally, everyone would be as careful as if the virus was everywhere, but nowhere near as scared as if it was everywhere. That’s a very difficult balance, and a reason for the ‘be kind’  message when it doesn’t quite work out.

August 26, 2020

Vaping and COVID

Q: Did you see this study saying vaping makes you five times more likely to get COVID?

A: Yes, but it’s not in the news, so it doesn’t count for StatsChat

Q: Newshub covered it.

A: Ok. Not entirely convinced

Q: They did a survey and they did lots of reweighting, the way you like. And said exactly what questions they asked.

A: Yes…

Q: So it’s not dodgy like the paper about heartburn drugs

A:  No, not like that.

Q: What’s your problem, then

A: The first problem is the proportion of people with COVID tests. No, actually the first problem is that COVID is so rare that this isn’t a reliable way to estimate proportions, and the second problem is that getting a test depended on a lot of other factors back then.  The third problem is the proportion of people with COVID tests

Q: Which is?

A:  Over 5% of people 13-17 and over 10% of people 21-24. By May 14, when the total cumulative number of tests in the whole US was only about 5% of the population — and you’d expect lower testing rates in younger people.

Q: Where are those numbers in the paper?

A: It’s a combination of the user and non-user columns in Table 1, using the proportions in the Supplementary Material. Which, again, the authors should get credit for providing.  What they call “COVID-related symptoms” are also very high: 14% of non-vapers and 26% of vapers reported having the symptoms right at the time they were surveyed.

Q: You’d think we would know if vaping increased these symptoms that much, separately from COVID. But if they oversampled people at high risk of COVID, it should at least be comparable across their survey

A: They did separate surveys for users and non-users of e-cigarettes, so that’s not actually obvious.

Q: But weighting?

A: Yes, but that doesn’t help as much with matching the surveys to each other, especially as they don’t have separate census totals for vapers and non-vapers.  In particular, in mid-May COVID was concentrated in relatively small areas of the US, and it would have been more valuable to make sure the locations matched up.

Q: But we know that smokers are at higher risk of catching the coronavirus, so this just confirms that.

A: Surprisingly, no.  Smokers don’t seem to be at higher risk of getting infection — and I guarantee that it’s not because no-one tried to show they were.  They may be at higher risk of getting seriously sick if they are infected, but even that’s not as clear as you’d expect.

Q: So should we believe this?

A: It’s not as simple as that.  This study does provide some evidence, but not as strong evidence as the researchers think. It certainly isn’t strong enough evidence to change policy on the regulation of e-cigarettes; whatever  you believed about that before seeing this study, you should believe about the same afterwards. And you probably do — it’s not a topic where people are noted for changing their minds.

August 24, 2020

A lanyard vs a piece of paper

Staged debate, as a format, has problems for actual discussion. So I wasn’t expecting the Stuff for/against on the COVID card to be more informative than the various discussions I’ve seen on Twitter.

This, from Ian Taylor was more than I’d anticipated, though

The Government has budgeted $210m for the 2023 census. That’s $210m to get a piece of paper to every New Zealander.

If you were a nasty suspicious person you might think I’ve quoted this out of context, and cut out all the things apart from the mail-out that go into making the value of the census over a billion dollars (PDF) — developing a sampling frame for dwellings, the hardware and software computer systems, data entry and validation,  monitoring of response rates, employing people to go door-to-door to catch up on non-response, the post-census enumeration survey, estimation of under-coverage, imputation of missing data, and so on.

You might think I’d left those out. But I didn’t. Describing the next Census as $210m to get a piece of paper to every New Zealander is like describing the COVID card as $100m to get a lanyard to every New Zealander. It leaves out all the stuff that makes it work.

And it’s not as if there aren’t other, more relevant, comparisons to make. A better comparison for the $100m cost of the COVID card would be the cost a of a few days more for Auckland at Level 3. If the COVID card could save us a week at level 3 in total, over the next couple of years, and there isn’t another solution that would be better or cheaper, then it easily makes sense.

I’m basically in favour of Bluetooth proximity measures as an adjunct to tracing in the current situation of mostly-successful elimination. I don’t think they come anywhere close to allowing us to relax the isolation/quarantine process, as some people had suggested earlier.

For the COVID card in particular I’d like to see some evidence about realistic fractions of people carrying the thing a year from now, and about how many false-positive ‘close contacts’ it generates. This information might exist, but it hasn’t been pushed by proponents. I’m not convinced by the opposing argument that it will take months to roll out:  the optimistic estimates for mass vaccination are probably eighteen months away; we’ve got plenty of time to improve. I think there are questions about cost and reliability and acceptability of COVID card relative to other Bluetooth and non-Bluetooth options, but I’ll leave them to the engineers and designers (preferably people who won’t simply dismiss any reluctance to wear the thing as ‘fashion’).  

The polling spectrum

I’ve had two people already complain to me on Twitter about the Stickybeak polling at The Spinoff. I’m a lot less negative than they are.

To start with, I think the really important distinction in surveys is between those that are actually trying to get the right answer, and those that aren’t.  Stickybeak are on the “are trying” side.

There’s also a distinction between studies that are really only making an effort to get internally-valid comparisons and those that are trying to match the population.  Internally-valid comparisons can still be useful: if you have a big self-selected internet sample you won’t learn much about what proportion of people take drugs, but you might be able learn how the proportion of cannabis users trying to cut down compares with the proportion of nicotine users trying to cut down, or whether people who smoke weed and drink beer do both at once or on separate days, or other useful things.

Stickybeak are clearly trying to get nationally representative estimates (at least for their overall political polling): they talk about reweighting to match census data by gender, age, and region, and their claimed secret sauce is chatbots to raise response rates for online surveys.

Now, just because you’re trying to get the right answer doesn’t mean you will. There are plenty of people who try to predict Lotto results or earthquakes, too.  And there, it’s too soon to say.  We know that online panels can give good answers: YouGov has done well with this technique, where their respondents are not necessarily representative, but they have a lot of information about them.   We’re also pretty sure that pure random sampling for political opinion doesn’t work any more; response rates are so low that either quota sampling or weighting is needed to make the sample look at all like the population.

So what do I think?  I would have hoped to see more variables used to reweight (ethnicity, and finer-scale geography), with total sample size larger, not smaller, than the traditional polls.  I’d also like to see a better uncertainty description. The Spinoff is quoting

For a random sample of this size and after accounting for weighting the maximum sampling error (using 95% confidence) is approximately ±4%.

The accounting for weighting is not always done by NZ pollsters, so that’s good to see, but ‘For a random sample of this size’ seems a bit evasive.  Either they’re claiming 4% is a good summary of the (maximum) sampling error for their results, in which case they should say so, or they aren’t, in which case they should stop hinting that it is.    Still, we know that the 3.1% error claimed by traditional pollsters is an underestimate, and they largely get a pass on it.

If you want to know whether to trust their results, I can’t tell you. Stickybeak are new enough that we don’t really know how accurate they are.

August 22, 2020

Causation and fair comparisons

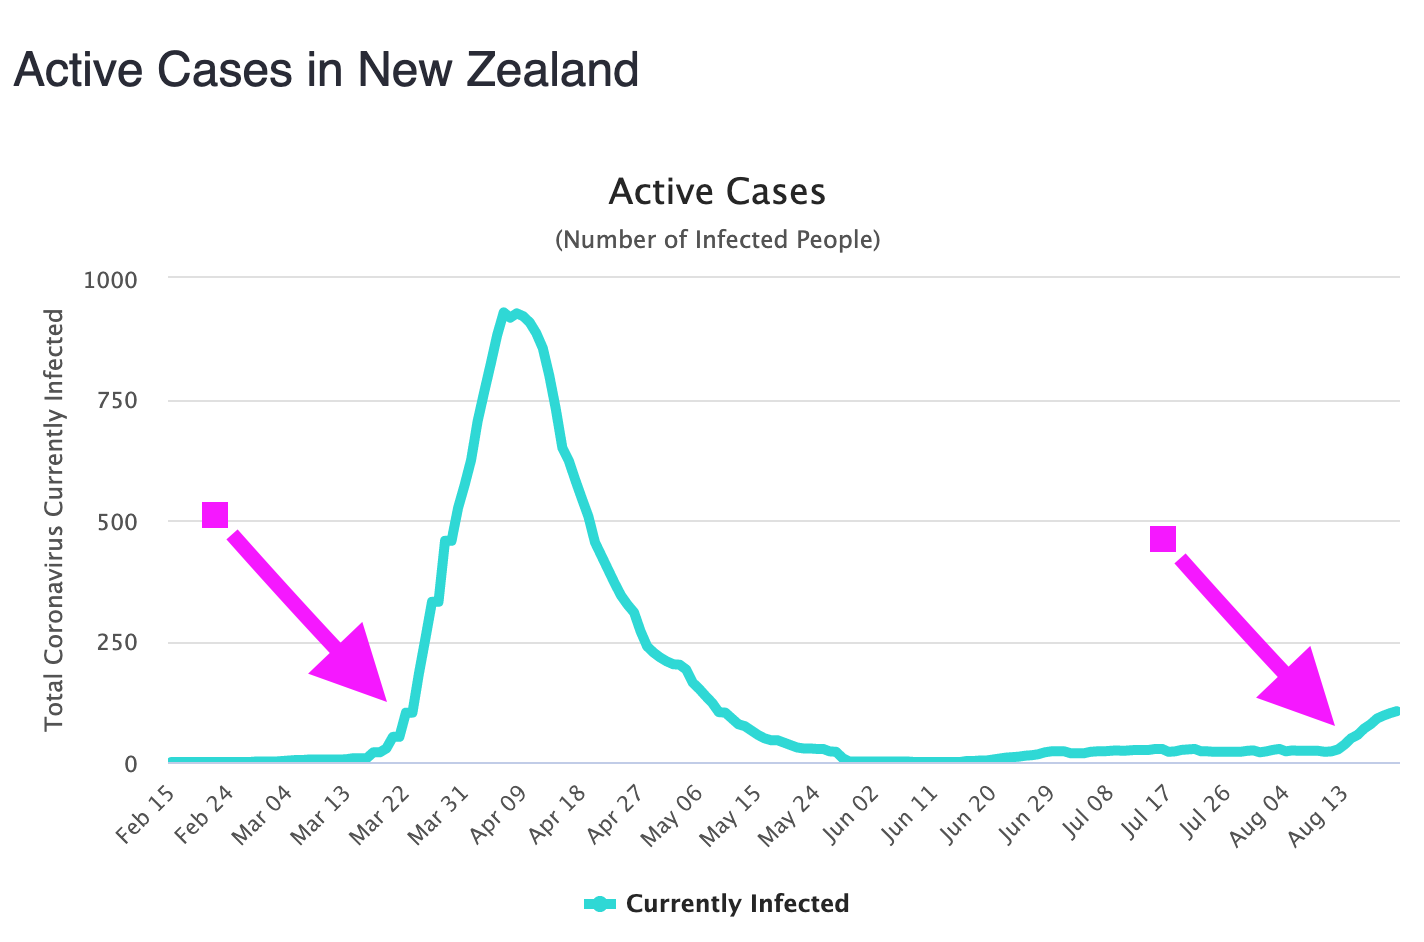
This is a version of a graph I saw on Twitter, posted by something who I think was trolling. The purple arrows are the lockdown decisions; the curve is the number of active COVID cases in New Zealand.  As you can see both lockdowns have been followed by a clear increase in the number of active cases, and no such increase has occurred any time when we haven’t imposed a lockdown. So, lockdowns cause COVID? Yeah nah.

Some of you are probably gearing up to say “correlation isn’t causation”; yes, well done. But that’s not the issue here. The relationship between number of active cases and lockdown is not a coincidence. There is a direct causal relationship. It just goes the other way: outbreaks cause lockdowns.

If we’re trying to estimate the effect of the California fires or the potential Gulf of Mexico hurricanes on COVID cases, it does make sense to compare infections shortly after and shortly before the event.  It obviously doesn’t for lockdown, but what (apart from “I know it when I see it”) is the distinction?

Economists would say the lockdown is endogenous (it’s coming from inside the epidemic). Epidemiologists, who have a more detailed taxonomy of bias, would talk about confounding by indication. People who take blood pressure drugs tend to have higher blood pressure than those who don’t; someone with  a headache is more likely to have taken paracetamol than someone without a headache. Interventions look bad precisely because you use them when they’re needed.  My bedroom tends to be warmer when the air conditioning is on (in summer) than when the heat pump is on (in winter).

We need a fair comparison to what actually happens after lockdown, and it isn’t business as usual.  This is where a model is useful.  We know roughly what happens to COVID case numbers with no intervention, because we have a fairly good mathematical model for how the disease spreads.  With no intervention, the number of new cases wouldn’t peak early and decline; it would keep going up.  With alternative, milder, interventions we’d need models on both sides of the comparison.  We have some data to validate the models, including genome sequencing to confirm which people were really infected as part of the same cluster, but the model does a lot of the work.

So, yes, we really can conclude that a New Zealand-style lockdown has worked.  This doesn’t mean it would work everywhere — just having the government say “lockdown” doesn’t do anything unless people cooperate — but the comparison to what we’d expect without it is evidence to say it worked here.

You get the same sort of problems in estimating the cost of lockdowns.  The cost compared to business as usual is relatively easy to estimate. That’s even a fair comparison for some policy questions: if we’re evaluating how much money it’s worth spending on infection control at the border, it’s a useful benchmark to know that a two-week Auckland lockdown won’t leave you much change out of a billion dollars.

But if you have an outbreak already and you want to estimate the cost of a lockdown compared to no lockdown, you can’t do a fair comparison to business as usual.  The economy will suffer during a prolonged outbreak: people will be reluctant to eat out or go to movies or rugby; jobs will be lost; less money will be available for spending.  Even before you add in the economic value of health, just the economic value of the economy will be down.  If you want to talk about the economic cost of the lockdown vs just letting the coronavirus run free, you need to do that comparison.  You can’t just compare to business as usual, any more than you can compare to business as usual and decide that lockdowns cause outbreaks.

August 19, 2020

Comparing two natural product Covid proposals

The Herald has a story headlined Pineapples could be key to treating virus about a proposed treatment for early COVID infection.  CNN (and various other sources) has a story about oleander extract† as a proposed treatment.

In both cases, the proposal is based on lab studies that have not be formally published, though the oleander one is available as a preprint.

More importantly, though, the Australian pineapple-based treatment is heading into proper clinical trials.  In lab tests it has been shown to disable the spike protein that the coronavirus uses for docking to cells.  A safety study is about to start, and has an entry in the ANZ clinical trial registry.  The treatment isn’t especially dangerous (it’s the enzyme that makes the inside of your mouth sore when you eat raw pineapple) but there’s no good data yet on the exact range of side-effects it is when squirted up your nose on a regular basis. If the side-effects aren’t too bad, the next step will presumably be a controlled trial looking at the effects on the virus, and then a larger controlled trial looking at whether it actually benefits the patients. That’s the usual testing procedure for new treatments.

The US oleander-based treatment† has lab test data showing it stops cells being infected. The manufacturer wants to get the drug into use rapidly, either in controlled trials or, if necessary, by calling it a ‘dietary supplement’† and evading drug approval rules.

In this case, the need for safety studies is obvious.  The data on viral replication in the lab looked at concentrations down to 0.05 mg/ml, or 50ng/ml. The lethal† blood concentration has been estimated as 10ng/ml.  A previous study of it as a cancer treatment saw ‘dose-limiting toxicities’ at about 2ng/ml — and this is ‘dose-limiting toxicity’ in the context of untreatable cancers, so it has to be pretty brutal.

There will obviously be some low enough dose that’s safe, but there’s currently not the slightest reason to expect those low doses to be effective. You should want lab studies at plausible human doses, and probably animal studies, before you tried giving this to patients, and before you tried advertising it to the President of the United States and the broader public.


† Do not eat/drink/smoke oleander. It will kill you unpleasantly.

August 15, 2020

Lotto, luck, and risk perception

There’s a big Lotto jackpot today, so it is my duty as a statistician to  write something about how people misunderstand probability. I don’t make the rules.

So, last week, I did a bogus poll on Twitter
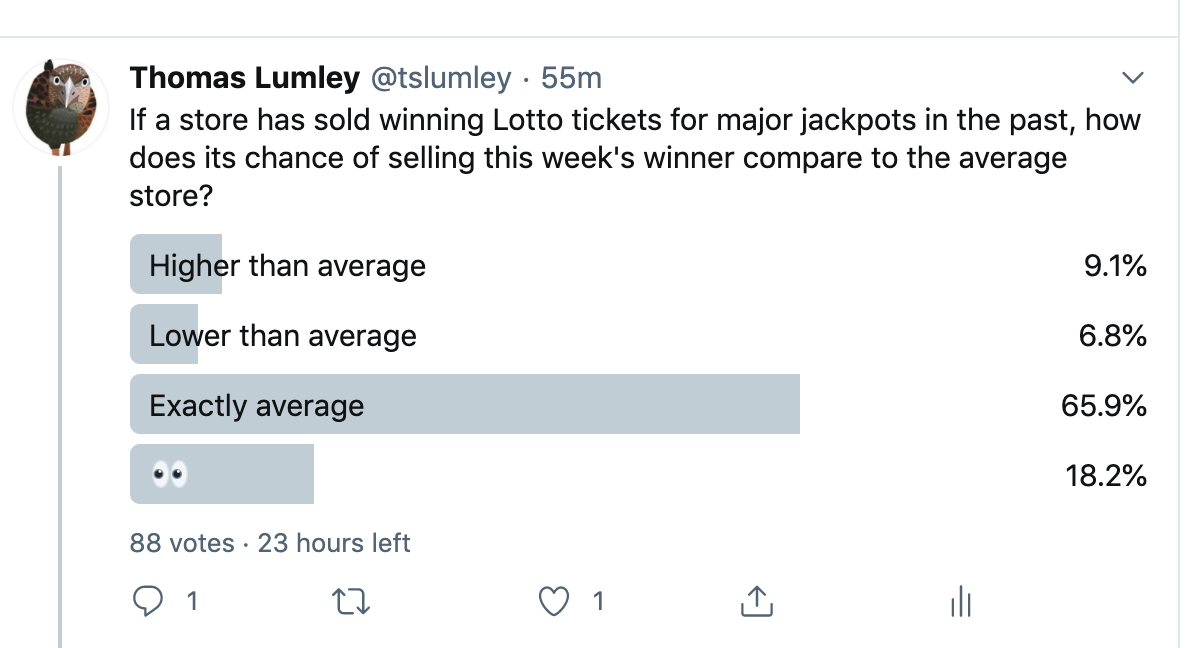
The results don’t tell you anything about any useful population,  because it was a bogus poll on Twitter, but it’s still interesting how many responses fell into the  trap.

Last week, we had headlines about ‘lucky’ stores to buy Lotto tickets.  Now, as you know, the probability that one of your chosen combinations wins does not depend at all on where you  bought the ticket, or how you chose the numbers. However, it is true that a shop which has sold winning tickets in the past is more likely to sell winning tickets in the future. Selling a winning ticket in the past is more likely for an outlet that sells lots of tickets, and an  outlet that sells lots of tickets is more  likely to sell  winning tickets in the future.  On top of that, it appears that people like to buy their tickets from outlets that have sold winning tickets in the past, which will increase the sales and therefore increase the number of future winners.  It doesn’t help the gamblers, but it does help the outlet.

In fact, saying it doesn’t help the  gamblers isn’t quite correct.   You’d hope, given the odds, that many people buying Lotto tickets were doing it primarily for entertainment (the cash return on tickets is negative, but that’s also true of beer and movies and rugby games and restaurant dinners).  Given that, anything that increases the entertainment value helps the gamblers,  and buying  from a ‘lucky’ store could count as a plus.

I also want to talk about a story in the Herald. It’s good on the  odds of winning and the impact of a ‘must win’ draw  — and quotes Dr Matt Parry, from Otago, which is generally a good indicator.  However, a separate part of the story says

Your chances of winning Powerball – one in 38 million – are less likely than you being struck by lightning – one in 280,000 – on your way to buy the ticket.

That seems not just wrong but incredibly wrong.   The story says “[m]ore than 1.9 million tickets were sold for the previous $50m must-be-won Powerball jackpot” (and that’s tickets, not lines), so at one in 280,000 we’d expect six or seven people to have been struck by lightning on their way to buy tickets.  According to this Radio NZ story, there were 13 ACC claims for lightning injury  in 3 years, and while that would leave out fatal injuries, the story also says a minority are fatal.  There’s no way you have a 1 in  280,000  chance of being struck by lightning on a routine shopping trip.

So where does this number come from? Well, the US also has a Powerball lottery, which has even lower odds of winning: one in  292 million. And there are news stories there with vaguely similar numbers.

The odds of grabbing the grand prize are 1 in 292.2 million, according to the game’s own assessment. To put this in context, your chances of being killed by a lightning strike are approximately 1 in 161,000. The odds of being killed in a shark attack are 1 in 3.7 million.

Even getting hit by a meteorite is more likely than winning the Powerball — 1 in 1.9 million.

The lightning-strike number looks to be a lifetime risk in the US, where lightning is more common than New Zealand, not the risk per shopping trip.

There are other problems with the numbers.  The 1 in 1.9 million for getting hit by a meteorite  is staggeringly wrong given that only one person in US history has been hit by a meteorite,  back in 1954.

How did the  1 in 1.9 million figure get past editing? Well, it probably wasn’t checked, but  there is a related number that’s arguably correct.  If you calculate the probability of dying due to a meteorite impact,  you have to consider the entire range of impacts from something the size of a golf  ball up to a significant asteroid.  The dinosaurs were wiped out (in part, probably) by an asteroid impact, 66 million years ago, so it would be reasonable to assume a risk in the ballpark of 1 in 100 million per year, giving a lifetime risk of experiencing the impact for an individual of one in a million or so.   Putting that together with expected  deaths from a major impact, it’s not unreasonable to get a 1 in two million risk for an individual  of dying because of an asteroid impact. On  the other hand, that’s not getting hit by a meteorite, and they shouldn’t be giving the number to two digits accuracy when even the order of magnitude must be uncertain.

So, if you’re in New Zealand and doing a careful risk assessment before buying a lottery ticket today, you probably don’t need to worry about lightning or low-flying rocks, but you should wear a mask. And if you’re in Auckland, maybe go to a local store or buy online.

Briefly

COViD edition:

  • T-cells. Recent research has found some people already have a T-cell immune response to the COViD virus — in some cases due to getting SARS Classic,  nearly two decade ago, and in some cases probably from animal coronaviruses. That’s encouraging for the prospects  of a vaccine.  But in the  US there are people saying this means those people are immune and we’re near the herd immunity threshold.  That’s completely untrue. The infectiousness of the virus was estimated from how fast it spreads in real populations — so if 50% of people are immune, that just means the virus is twice as infectious as we thought, and the herd immunity threshold is higher.
  • T-cells: Some people have T-cell responses already, but we don’t actually know those people are immune, or even less susceptible. As Ed Yong explains Immunology is where intuition goes to die
  • If you want to know about vaccine candidates for COVID: first, read the introduction by Siouxsie Wiles and Toby Morris, then look at the blogs of Hilda Bastian and Derek Lowe. Hilda is an expert on evidence in health and started out as a healthcare consumer advocate. Derek  is a pharmaceutical chemist.
  • What is genome sequencing for the virus and why? Basic introduction from Siouxsie and Toby at The Spinoff, more from David Welch’s op ed at Stuff
  • Why we need randomised trials: The Mayo Clinic, in the US, has given plasma from recovered COVID cases to more than 35,000 people and they still don’t really know if it works.
  • And now for something completely different: there’s an IMDB entry for the 1pm Covid Briefing, and reviews of season 2 are starting to stream in.
August 14, 2020

New COVID tests?

From NewsHub: Coronavirus: New test might detect COVID-19 in just a second, doesn’t involve nose swab.

They get points for a less positive headline than the Reuters original, but

The center said in an initial clinical trial involving hundreds of patients, the new artificial intelligence-based device identified evidence of the virus in the body at a 95 percent success rate.

As far as I can tell, the claim comes entirely from a press release — I haven’t been able to find any more data. What this implies is that Reuters (and NewsHub) don’t have any way to know what “a 95% success rate” actually means.

A COViD test can be wrong in two ways: it can miss actual infections or it can think there’s an infection when there isn’t.  In the New Zealand context, missing only 5% of infections would be doing well.  Thinking 5% of healthy people are infected would make the test useless. We’ve done roughly 500,000 COVID tests so far in New Zealand. If 5% were false positives, that would be 25,000 people incorrectly thought to be cases.

Also, it matters a lot when people are tested, and for what reason. Someone who is currently sick is  more likely to test positive than someone who is  infected but has not developed symptoms.  An initial clinical study will usually involve people whose infection status is known, leaving out  the more important and more difficult cases.

To be fair to the journalists, there’s expert comment in the story that makes some of these points

The amount of virus present in saliva increases as patients get sicker, he said, and a big challenge is to detect in “people who are borderline”.

“It will be a game changer only if we see validation of this technology against the current technology,” he said.

It might also be worth noting that the researcher in  question, Dr Eli Schwarz, has a previous example of overly-optimistic press releases during the pandemic. He is running a trial of the anti-parasite drug ivermectin, describing it as a possible cure.  Unfortunately, the Australian lab experiment that is said to support ivermectin use found that the drug destroyed the virus only at concentrations nearly five orders of magnitude higher than those being used in the trial.

August 7, 2020

Briefly

  • Newshub has a story about so-called ‘lucky’ Lotto stores.  I’ll recycle a previous response.
  • The Productivity Commission are arguing that the extra week in lockdown was unnecessary and very expensive. Their analysis is wrong; it does not seem to consider whether and how much the extra week reduced the risk of needing a second lockdown, which was part of the reason for doing in.  I’m not saying the extra week was the right decision — you can’t tell, without modelling the extra risk, which they didn’t do.  It’s like saying insurance is not cost-effective because your house didn’t burn done. Insurance may or may not be cost-effective, but that isn’t how you tell.
  • Ed Yong at the Atlantic, on why there’s so much we don’t know about COVID immune response: Immunology Is Where Intuition Goes to Die
  • The Human Gene Nomenclature Committee has changed the names of a bunch of genes. Not because they’re named after unpleasant historical figures, but because Excel keeps trying to turn them into dates:  SEPT1, OCT4, MARCH1.  Spreadsheets are useful (and Excel is the world’s most popular statistical software), but you do need to keep a sharp eye on them
  • Newshub reports on an attempt to get Pharmac to pay for a drug that costs half a million dollars per patient per year.  I’ll outsource the basic statistical comparison to Matt Nippert on Twitter — the total cost would be about a quarter of Pharmac’s budget (and I’ll just note that this is slightly more than it spends on cancer.)
  • If you thought our Census had problems, look at the US.  The American Statistical Association and the American Association for Public Opinion Research are among the groups who want the data collection extended rather than shortened.