Posts written by Thomas Lumley (2645)

avatar

Thomas Lumley (@tslumley) is Professor of Biostatistics at the University of Auckland. His research interests include semiparametric models, survey sampling, statistical computing, foundations of statistics, and whatever methodological problems his medical collaborators come up with. He also blogs at Biased and Inefficient

October 23, 2019

Publicise it while it still works?

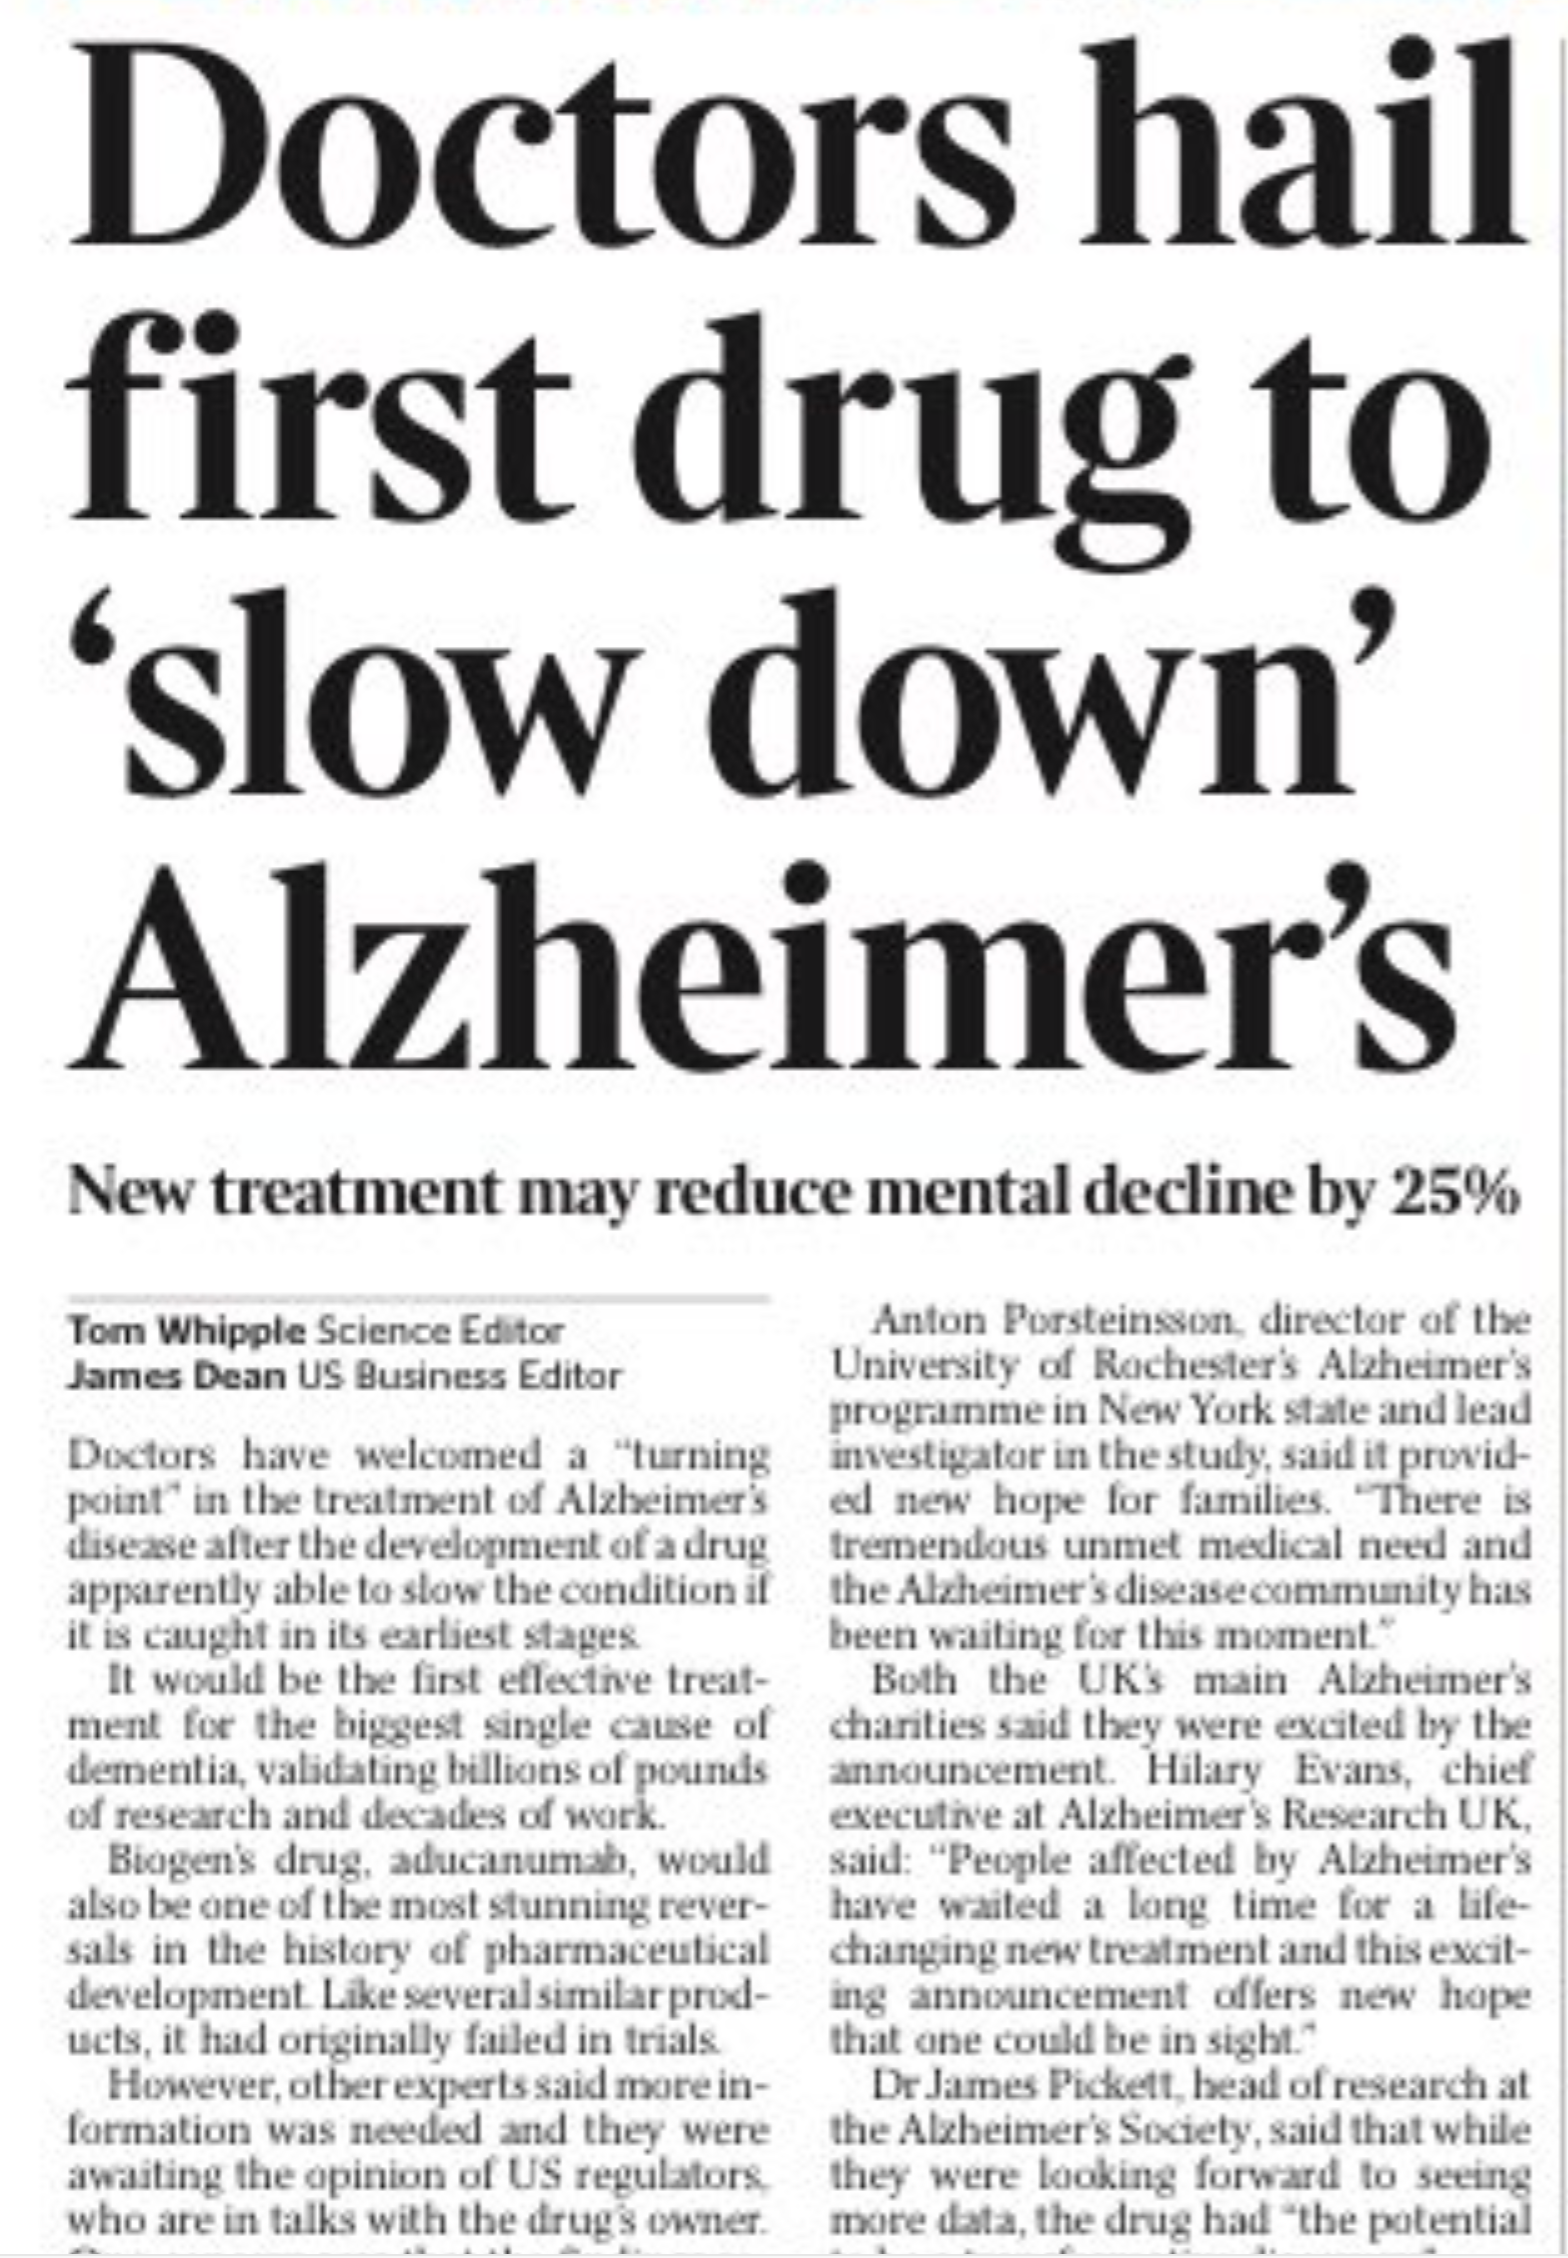
This is from The Times. In fact, per the BBC, it’s the leading story on the front page of tomorrow’s Times, above Brexit.

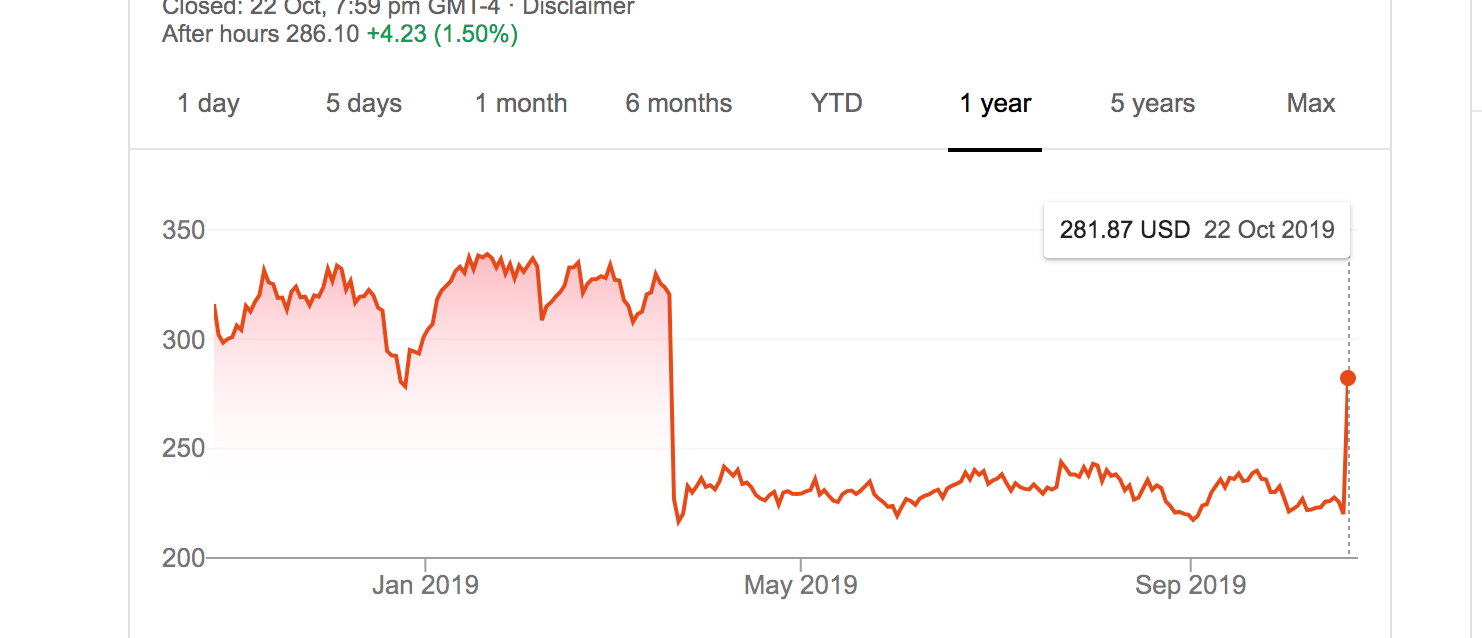
The drug in question, aducanumab, had promising and widely reported early results. It was less widely reported that the definitive clinical trials were stopped early in March of this year, when it wasn’t doing any good.  The decision to stop was based on data collected through last December; after stopping, more data has rolled in. Biogen, the makers of the drug, are now claiming that the data accumulated since then show a benefit at the highest dose; the FDA have given them permission to apply for approval.  Here’s what has happened to their stock price

So far, no detailed data or analyses have been published. The New York Times story, which is a lot more chill, says that the results will be presented at a conference in December. A working drug would be genuinely important news, but putting it on the front page right now would be a bit premature even in a slow news week.

There’s a general pattern with drug breakthrough news, where the good news is presented with big headlines in the main body of the paper, and the bad news that walks it back is in the business section, with small headlines.  One long-term result is a misleadingly optimistic public view of new drugs, most of which aren’t breakthroughs.


Update: note that the post-good-news stock price jump was a lot smaller than the post-bad-news collapse, and the price fell over the day after the peak — the stock markets aren’t betting on this being a spectacularly successful drug.

October 21, 2019

Algorithms Charter: request for comment

There’s a “Draft Algorithms Charter” from the Government

The Ministry of Statistics is asking for  feedback on the draft charter by 31 December 2019. Specifically:

  • Does the proposed text provide you with increased confidence in how the government uses algorithms?
  • Should the Charter apply only to operational algorithms?
  • Have we got the right balance to enable innovation, while retaining transparency?
  • Have we captured your specific concerns and expectations, and those of your whānau, community or organisation?


Briefly

  • Andrew Chen’s twitter reactions  to a workshop at VUW on regulating facial recognition technologies
  • Interactive exploration of fairness in predictive sentencing algorithms (the same issue as my ‘Kinds of fairness worth working for‘)
  • Beautiful new atlas of the land and people of Aotearoa, “We Are Here“, by Chris McDowall and Tim Denee. Also, their code and data source repository
  • Visualisations of various cities by the street name suffix, eg, Street vs Road vs Avenue
  • From Stuff: ‘Statistics New Zealand challenges Colliers analysis on housing demand’.   There has been a tendency to treat the 2013 2018 Census data as uniformly bad, and it would be good if people were a bit more discriminating — some of the data are of very high quality, and some are of very low quality.  You might, for example, read our report
September 24, 2019

Census news

The first data release from the Census happened yesterday.  There are more people in New Zealand than there were in 2013.  In Auckland, 42% of the population were born overseas. There’s going to be a new electorate in the North Island somewhere. And various other facts.

I’ve been on an independent expert panel providing an external review of data quality. We also gave our first report yesterday.  It’s here.

Basically, there’s good news and bad news.

  • Stats NZ used the 2013 Census and other government data to fill in people who were missing from the 2018 Census, and to bring in their data where available
  • It worked well for general population counts.
  • It didn’t work at all for some variables, because they don’t have other data sources
  • It worked to varying degrees for other variables
  • The quality depends a lot on what you want to use it for
  • We weren’t convinced about social and cultural license for the use of administrative data

Reading the executive summary of the report is a good way to be at least slightly informed (relative to, say, Twitter), but you could also read the whole thing — we hope it’s fairly accessible.

September 18, 2019

How single transferable vote works

NZ is having local elections.  Some of the elections work by single transferable vote.  The working of STV are not precisely statistics, but they’re nerdy enough in a vaguely mathematical way to be on topic.  And I’ve run the counting of STV elections (for the Monash Association of Students), so I have a pretty good grasp of how it works.

Rather than explain it to you, though, I’m going to outsource to Graeme Edgeler’s nice and accurate explanation.


Briefly

September 14, 2019

Hadley Wickham talks to Kim Hill

Hadley is Chief Scientist of RStudio, an alumnus and adjunct Professor here in the Department of Statistics, and the recent winner of the Presidents’ Award from the Committee of Presidents of Statistical Societies, one of the top honours in statistics.

That’s two celebrity statisticians interviewed by Kim Hill in consecutive weeks, which must be some sort of record.

Listen here

September 10, 2019

Think of a number and multiply it by 260,000,000

We haven’t had one of these for a while, but there’s some dodgy-looking extrapolation going on in the Keep New Zealand Beautiful litter audit. The audit itself is a good idea: measure litter in a detailed and reproducible way, so you can compare amounts now to amounts in the future and see whether things are getting greener and cleaner.  And I don’t have any problems with how they conducted the survey.

But.  The report (PDF) says (p18)

10,269,090,000 LITTERED CIGARETTE BUTTS polluting our ecosystem

and the Herald story says

Despite drops in smoking rates, discarded cigarette butts remained a big headache: some 10,269,090,000 were picked up, or 2,142 for every person in the country.

There weren’t 10 billion cigarette butts picked up. That would take a while.  There were 39 cigarette butts picked up per 1000 square metres of land surveyed. With 10,000 477,000 square metres surveyed [update: I was confused by Table 2 in the report, which says 10,000 but is just illustrating the calculation (that’s the Table 2 on p25, not one of the others)], that comes to 390 18600.  The detailed breakdowns in the report are fine, but there are also these extrapolations, where the amount of litter per 1000 square metres is scaled up by the number of 1000 square metre patches it would take to cover the whole country — about 260,000,000.

And, similarly, from the Herald quoting KNZB chief executive Heather Sanderson

“Extrapolated, that means 265,324,848 litres of illegal dumping – enough to fill 2,123 rail carriages, which if you stack them on top of each other, would be as high as 151 Sky Towers.”

is obtained by finding just under 1 litre (or 0.001 cubic metres) per 1000 square metres in the survey, and scaling up to the whole country. (Also, those imaginary rail carriages are being stacked end on end, which is probably not good for them)

Scaling up like this is how survey statistics works, but only if the sites you survey are an equal-probability random sample of the area  The report doesn’t say they were, and it seems pretty unlikely, because it’s quite hard to get to a lot of randomly chosen bits of New Zealand, and these places  — whether they’re up inaccessible mountains or in the middle of a big dairy farm  — will tend to have less litter.

[Update: it’s obvious not an equal-probability sample of NZ; it could be some sort of stratified sample of the types of areas they were focusing on]


[Update, 13 September: Keep NZ Beautiful has modified the report to take out the dodgy extrapolations.  Congratulations.  The Herald hasn’t modified their story, though.]

September 9, 2019

Briefly

  • An actual evaluation: ‘Kentucky lawmakers thought requiring that judges consult an algorithm when deciding whether to hold a defendant in jail before trial would make the state’s justice system cheaper and fairer by setting more people free. That’s not how it turned out.’ Ars Technica
  • From the CEO of Palantir, in the Washington Post “Companies and innovators in Silicon Valley have immense, almost monopolistic power. Many have lucrative contracts with the government. But under scrutiny from employees and activists, they are being pressured to avoid controversy by picking and choosing which contracts to accept and which to abandon. “ He thinks that’s a bad thing.
  • The winners of MonoCarto 2019 (formerly known as the Monochrome Mapping Competition)
  • We’re about to have another bit of democracy.  To prepare, places.figure.nz gives you information about your local government areas. The Spinoff’s “Policy Local” is asking all local government candidates a set of questions and putting the answers in an app
  • Those Hurricane Maps Don’t Mean What You Think They Mean Albert Cairo in the NYT.

The Art of Statistics

Kim Hill on Radio NZ had a long interview with David Spiegelhalter, who is Professor of the Public Understanding of Risk, at Cambridge.   He has a new book, “The Art of Statistics: Learning from Data”