Posts written by Thomas Lumley (2645)

avatar

Thomas Lumley (@tslumley) is Professor of Biostatistics at the University of Auckland. His research interests include semiparametric models, survey sampling, statistical computing, foundations of statistics, and whatever methodological problems his medical collaborators come up with. He also blogs at Biased and Inefficient

February 13, 2016

Detecting gravitational waves

The LIGO gravitational wave detector is an immensely complex endeavour, a system capable of detecting minute gravitational waves, and of not detecting everything else.

To this end, the researchers relied on every science from astronomy to, well, perhaps not zymurgy, but at least statistics. If you want to know “did we just hear two black holes collide?” it helps to know what it will sound like when two black holes collide right at the very limit of audibility, and how likely you are to hear noises like that just from motorbikes, earthquakes, and Superbowl crowds.  That is, you want a probability model for the background noise and a probability model for the sound of colliding black holes, so you can compute the likelihood ratio between them — how much evidence is in this signal.

One of the originators of some of the methods used by LIGO is Renate Meyer, an Associate Professor in the Stats department. Here’s her comments to the Science Media Centre, and a post on the department website

February 11, 2016

Anti-smacking law

Family First has published an analysis that they say shows the anti-smacking law has been ineffective and harmful.  I think the arguments that it has worsened child abuse are completely unconvincing, but as far as I can tell there isn’t any good evidence that is has helped.  Part of the problem is that the main data we have are reports of (suspected) abuse, and changes in the proportion of cases reported are likely to be larger than changes in the underlying problem.

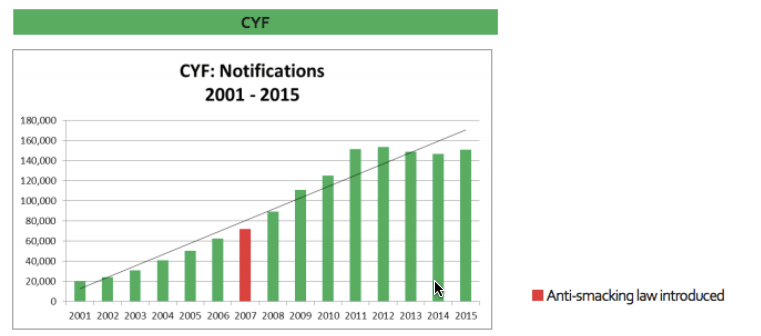
We can look at  two graphs from the full report. The first is notifications to Child, Youth and Family

ff-1

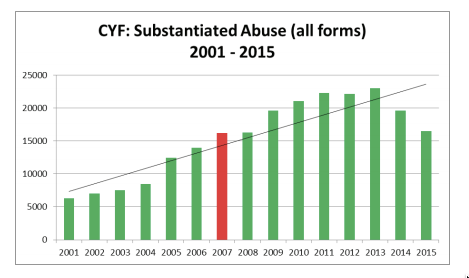
The second is ‘substantiated abuse’ based on these notifications

ff-2

For the first graph, the report says “There is no evidence that this can be attributed simply to increased reporting or public awareness.” For the second, it says “Is this welcome decrease because of an improving trend, or has CYF reached ‘saturation point’ i.e. they simply can’t cope with the increased level of notifications and the amount of work these notifications entail?”

Notifications have increased almost eight-fold since 2001. I find it hard to believe that this is completely real: that child abuse was rare before the turn of the century and became common in such a straight-line trend. Surely such a rapid breakdown in society would be affected to some extent by the unemployment  of the Global Financial Crisis? Surely it would leak across into better-measured types of violent crime? Is it no longer true that a lot of abusing parents were abused themselves?

Unfortunately, it works both ways. The report is quite right to say that we can’t trust the decrease in notifications;  without supporting evidence it’s not possible to disentangle real changes in child abuse from changes in reporting.

Child homicide rates are also mentioned in the report. These have remained constant, apart from the sort of year to year variation you’d expect from numbers so small. To some extent that argues against a huge societal increase in child abuse, but it also shows the law hasn’t had an impact on the most severe cases.

Family First should be commended on the inclusion of long-range trend data in the report. Graphs like the ones I’ve copied here are the right way to present these data honestly, to allow discussion. It’s a pity that the infographics on the report site don’t follow the same pattern, but infographics tend to be like that.

The law could easily have had quite a worthwhile effect on the number and severity of cases child abuse, or not. Conceivably, it could even have made things worse. We can’t tell from this sort of data.

Even if the law hasn’t “worked” in that sense, some of the supporters would see no reason to change their minds — in a form of argument that should be familiar to Family  First, they would say that some things are just wrong and the law should say so.  On the other hand, people who supported the law because they expected a big reduction in child abuse might want to think about how we could find out whether this reduction has occurred, and what to do if it hasn’t.

February 10, 2016

Cheese addiction yet again

So, for people just joining us, there is a story making the rounds of the world media that cheese is literally addictive because the protein casein stimulates the same brain receptors as opiates like heroin.

The story references research at the University of Michigan, which doesn’t show anything remotely related to the claims (according not just to me but to the lead researcher on the study). This isn’t anything subtle; there is not one word related to the casein story in the paper. The story is made up out of nothing; it’s not an exaggeration or misunderstanding.

This time the story is in GQ magazine. It references the December version (from the Standard), but adds some of the distinctively wrong details of earlier versions (“published in the US National Library of Medicine”)

If I were a science journalist, I think I’d be interested in who was pushing this story and how they’d fooled so many people.

Summer daze

From the Herald:

“Our brains are sharper in summer than in winter, a study has found,” 

The tests were done during various weeks over the course of a year. The subjects performed better during the summer”

It takes some effort to find which study, because neither the journal nor any of the researchers are named.  It turns out to be this research in Proceedings of the National Academy of Sciences. The press release says

Performance on both tasks remained constant, but the brain resources used to complete each task changed with the seasons.

If you look in more detail (behind a paywall, sadly), the researchers found the same performance on the tests but with higher brain activity in summer than in winter for one tasks, and higher activity in autumn than spring for the other.  I’d tend to interpret that as our brains being in lower gear in summer — higher revs for the same actual speed — but the research paper didn’t come down one way or the other on this issue.

February 8, 2016

Nice cup of tea

Q: So, did you see that tea prevents hip fractures now?

A: The Herald story? Yes.

Q: Is this mice?

A: No, people.

Q: But it’s not experimental, it’s just correlation?

A: Yes, but better than usual.

Q: Why?

A: The two big problems with diet studies are that measurements are horribly inaccurate and that people who have healthy diets are also weird in lots of other ways which it’s hard to disentangle.

Q: So tea is different because it’s easy to measure?

A: They divided women into “3+ cups per day”, “Basically never”, and a middle group.  It’s not hard to distinguish people who drink tea as their main liquid intake from people who hardly ever drink it.

Q: And the healthy weirdo effect?

A: Tea drinking isn’t really thought of as a health thing, and (among 80 year old Australian women) it’s probably not a social class marker either.

Q: You usually complain about extrapolation as well. Did they really measure bone density?

A: Better than that, they really measured hip fractures.

Q: So we can believe it?

A: Perhaps?

Q: What’s your issue with this one, then?

A: The evidence isn’t overwhelmingly strong, and we wouldn’t have heard about this study through the media it if it wasn’t positive. And there have been a lot of other studies with mixed results.

Q: As good as this one?

A: No, but still.

Q: Would it have helped if they’d measured bone density?

A: They did, and they found it didn’t explain all the correlation with tea drinking, which is a bit surprising.

Q: Don’t you always tell people those mediation analyses are unreliable?

A: I suppose. But bone mineral density is measured pretty accurately, so it should work better than usual.

Q: Why don’t you want tea to be beneficial?

A: I do want tea to be beneficial; I drink a lot of it. But almost nothing prevents hip fractures, and this is a big difference.

Q: How big?

A: More than 40% reduction for hip fractures, which is in the ballpark of what the potent bisphosphonate drugs manage.

Q: So should we drink tea?

A: It’s unlikely to be harmful, and it might help with fractures. If you hate the taste, though, this probably isn’t strong enough evidence to force yourself to drink it.

Q: How about eating green tea KitKat?

A: I’m fairly sure consumption of that was low in this cohort of elderly Australian women.

February 7, 2016

Why do we care?

From the history of the Manchester Statistical Society

Manchester Statistical Society was a pioneering organisation: It was the first organisation in Britain to study social problems systematically and to collect statistics for social purposes. In 1834 it was the first organisation to carry out a house-to-house social survey.

The Society was formed in September 1833 at a time of severe social problems. Few of the founders were statisticians in the modern, technical sense. But, they were interested in improving the state of the people and believed that establishing the facts regarding social problems was a necessary first step. 

From an earlier organisation in London (via)

‘The privation and misery endured by the productive classes of society in Great Britain in 1816 and 1817, led to the formation of an Association in London, for the purpose of investigating the nature and extent of that misery; and of ascertaining, if possible, how far it resulted from avoidable or from unavoidable causes; and how far repetitions of similar ills were likely or not to occur’.

Groups of wealthy men saying they want to improve society isn’t new.  Nor is it new that they don’t know enough to do much good.  What was different in the early nineteenth century was that they recognised they didn’t know enough. The Statistical Societies were founded to provide information about social problems that went beyond any individual’s range of anecdotes, because the truth mattered.

The range of statistics has broadened immensely since then, especially with the help of computers. At the foundation is still the principle that one person’s reckons aren’t enough: the world is more complicated than that and the truth matters.

I’m not arguing that statistics has to be Important and Serious. If you want to know whether The Rock plays the same music at the same time each day or who is likely to win the rugby, statistics can help there. If you care enough about how other people eat their cereal, that’s a valid topic for investigation. The bottom line is that you do actually care about the answer; that the truth matters.

For a depressingly large fraction of surveys in the news today, no-one really cares whether the answer is accurate or even what the question means. Maybe it’s ok to have sections of the newspaper where facts aren’t really relevant — you need to ask a journalist, not me. But when the truth doesn’t matter, stop pretending to use statistics.

Zombie bogus surveys

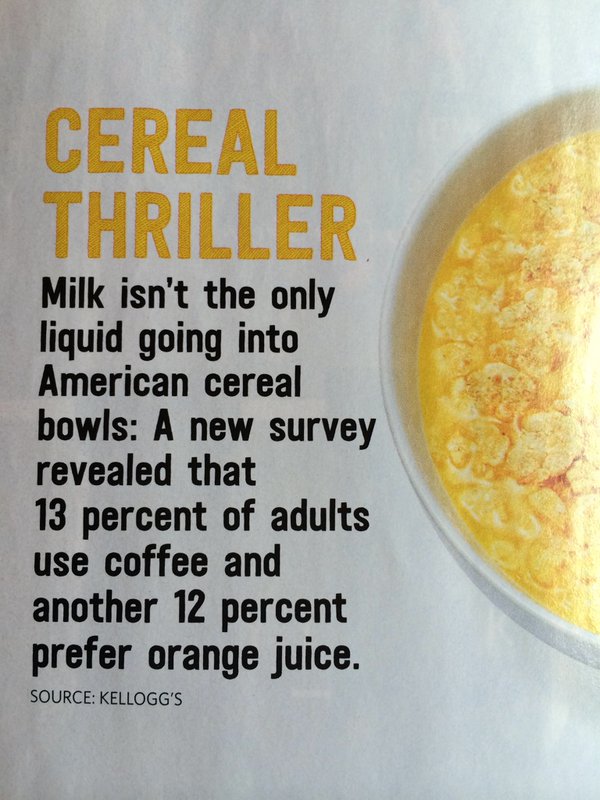
From Food Network magazine, via Twitter, via Julie Blommaert

Caj-ZOKUEAAr9vm

There’s no more detail than “Kellogg’s” as the source, and the Kellogg’s website is very sensibly not admitting to anything.

Some more Google finds two stories from September last year — getting the factoid into a real paper magazine, because of the publication time lag, gives it another chance to roam the earth looking for brains.

Even though it has to be the same survey, the story from Vice says “a full one-fifth of Americans are using orange juice in their cereal instead of milk,” though Bustle says “More than 10 percent of Americans admitted to using orange juice or coffee”.   It’s not just that the numbers are inconsistent, the phrasing in one case suggests “do you usually?” as the question, the other “have you ever?” It matters, or at least it would if anything about this mattered.

We’re also not told whether these are really supposed to be proportions of “Americans” or of “Americans who eat cereal”, or “Americans who eat cereal for breakfast”, or whatever.

Usefully, the Vice story does give a bit more detail about the survey

Two thousand US consumers and college students from all over the country participated in the study, with about 30 percent male subjects and 70 percent female. The participants were of all ages, with half being college students and the rest varied (14 percent between the ages of 25 and 34 years old, 16 percent between 35 and 44 years old, about a quarter between 45 and 54 years old, and the rest scattered in older or younger age groups). 

They don’t say how the participants were recruited or surveyed, but there’s enough information there to make it clear the data would be meaningless even if we knew what the questions were and what percentages the survey actually found.

Briefly

  • Locksmiths gaming Google and Google Maps: from the New York Times. 
  • We have “lead generation systems” here too, but I haven’t seen any suggestion that these are scams, just somewhat misleading advertising aiming to look local. Eg, from a site that’s appealingly honest about how it works

If your business covers the whole of Auckland for example then we would set up 200 websites for you which is one for every suburb in the city covering 6 districts

  • What’s the first word that comes to your mind starting with SUPP? If you said “SURGERY”, you’re not alone — or maybe you’re not real. “Disturbing oddities” in a research paper.
  • A map of the longest flights — Auckland-Houston and Auckland-Vancouver don’t make it.
  • Herald Insights has an exploration of unemployment rates over the recession and recovery, by census ethnic group and age.
  • A company that may be taking measurement too far: “Any meeting of at least three people is expected to hold at least one poll.”
February 6, 2016

Bogus polls from Nature

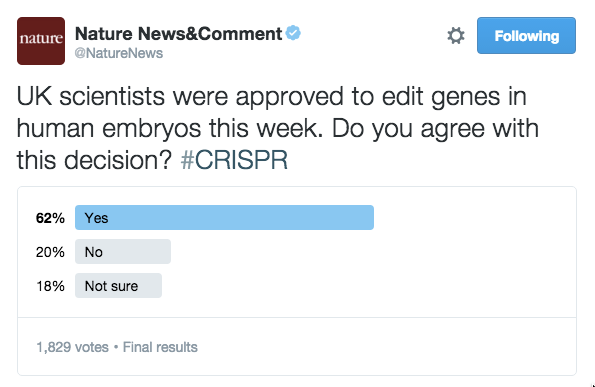
Soon after Twitter polls were introduced, Al-Jazeera News used one to poll its followers about US intervention in Syria. Fortunately, it seems to have been a failed experiment (the poll, that is).

Now, Nature News is doing it:

naturepoll

Twitter polls can work as jokes and commentary, and they might work for gathering opinions from your friends. They shouldn’t be allowed to masquerade as data collection.

February 5, 2016

DIY investigations

So, the Herald has a story headlined Men’s DIY skills ‘dying out’ – study. Here’s the first three paragraphs

Men are no longer able to carry out traditional DIY – with most now opting to call in tradesmen, research shows.

Most men cannot change a tyre, while only half can wire a plug and just one in five are able to fix a dripping tap.

Three in five men would need to call in a plumber to unblock a toilet, while only a third feel confident about putting together flat-pack furniture.

You might think this raises some questions. For example:

  • Is there any information in the story suggesting the numbers are reliable? (not really)
  • Do they have comparable data from the past to support the ‘dying out’, ‘no longer able’ and so on? (no)
  • Isn’t this whole gendered housework thing mildly offensive and about five decades out of date? (yes)
  • Hasn’t it been a cliche since flat-pack furniture was invented that most people don’t feel confident assembling it? (yes)

A question that might not spring immediately to mind: “What country are these numbers from?”

The stock photo isn’t much use. It shows a man carrying a plank while smiling — maybe one of the other dying skills?  Google Image Search finds a vendor who has it tagged as Calgary, Alberta (Canada).

However, there are two clues in the text I’ve quoted.  The first clue is that there aren’t any specifically NZ journalistic cliches — it’s hard to imagine a Kiwi writing this sort of crap without referencing, say, number 8 wire.

The second clue is more subtle: “only half can wire a plug”.  Until 1992, appliances in the UK were often sold without plugs attached, and wiring a plug was a more important household skill than in the rest of the world.

Reading on, the fourth paragraph confirms that this is a UK story. It’s from the Daily Mail and it exists to advertise a UK men’s clothing company.  If you found the story annoying, I would encourage you not to investigate their blog further.

A modest proposal: it appears that news sites have to publish a certain number of these surveys. Maybe they could trim out the name of the sponsoring company, and just provide it in a link for readers who really cared? Then the story could be assessed on its true news (or perhaps entertainment) value.