Search results for lotto (43)

October 5, 2020

Auckland is bigger than Wellington

There’s a long interactive in the Herald prompted by the 2000th Lotto draw, earlier this week.  Among other interesting things, it has a graph of purporting to show the ‘luckiest’ regions

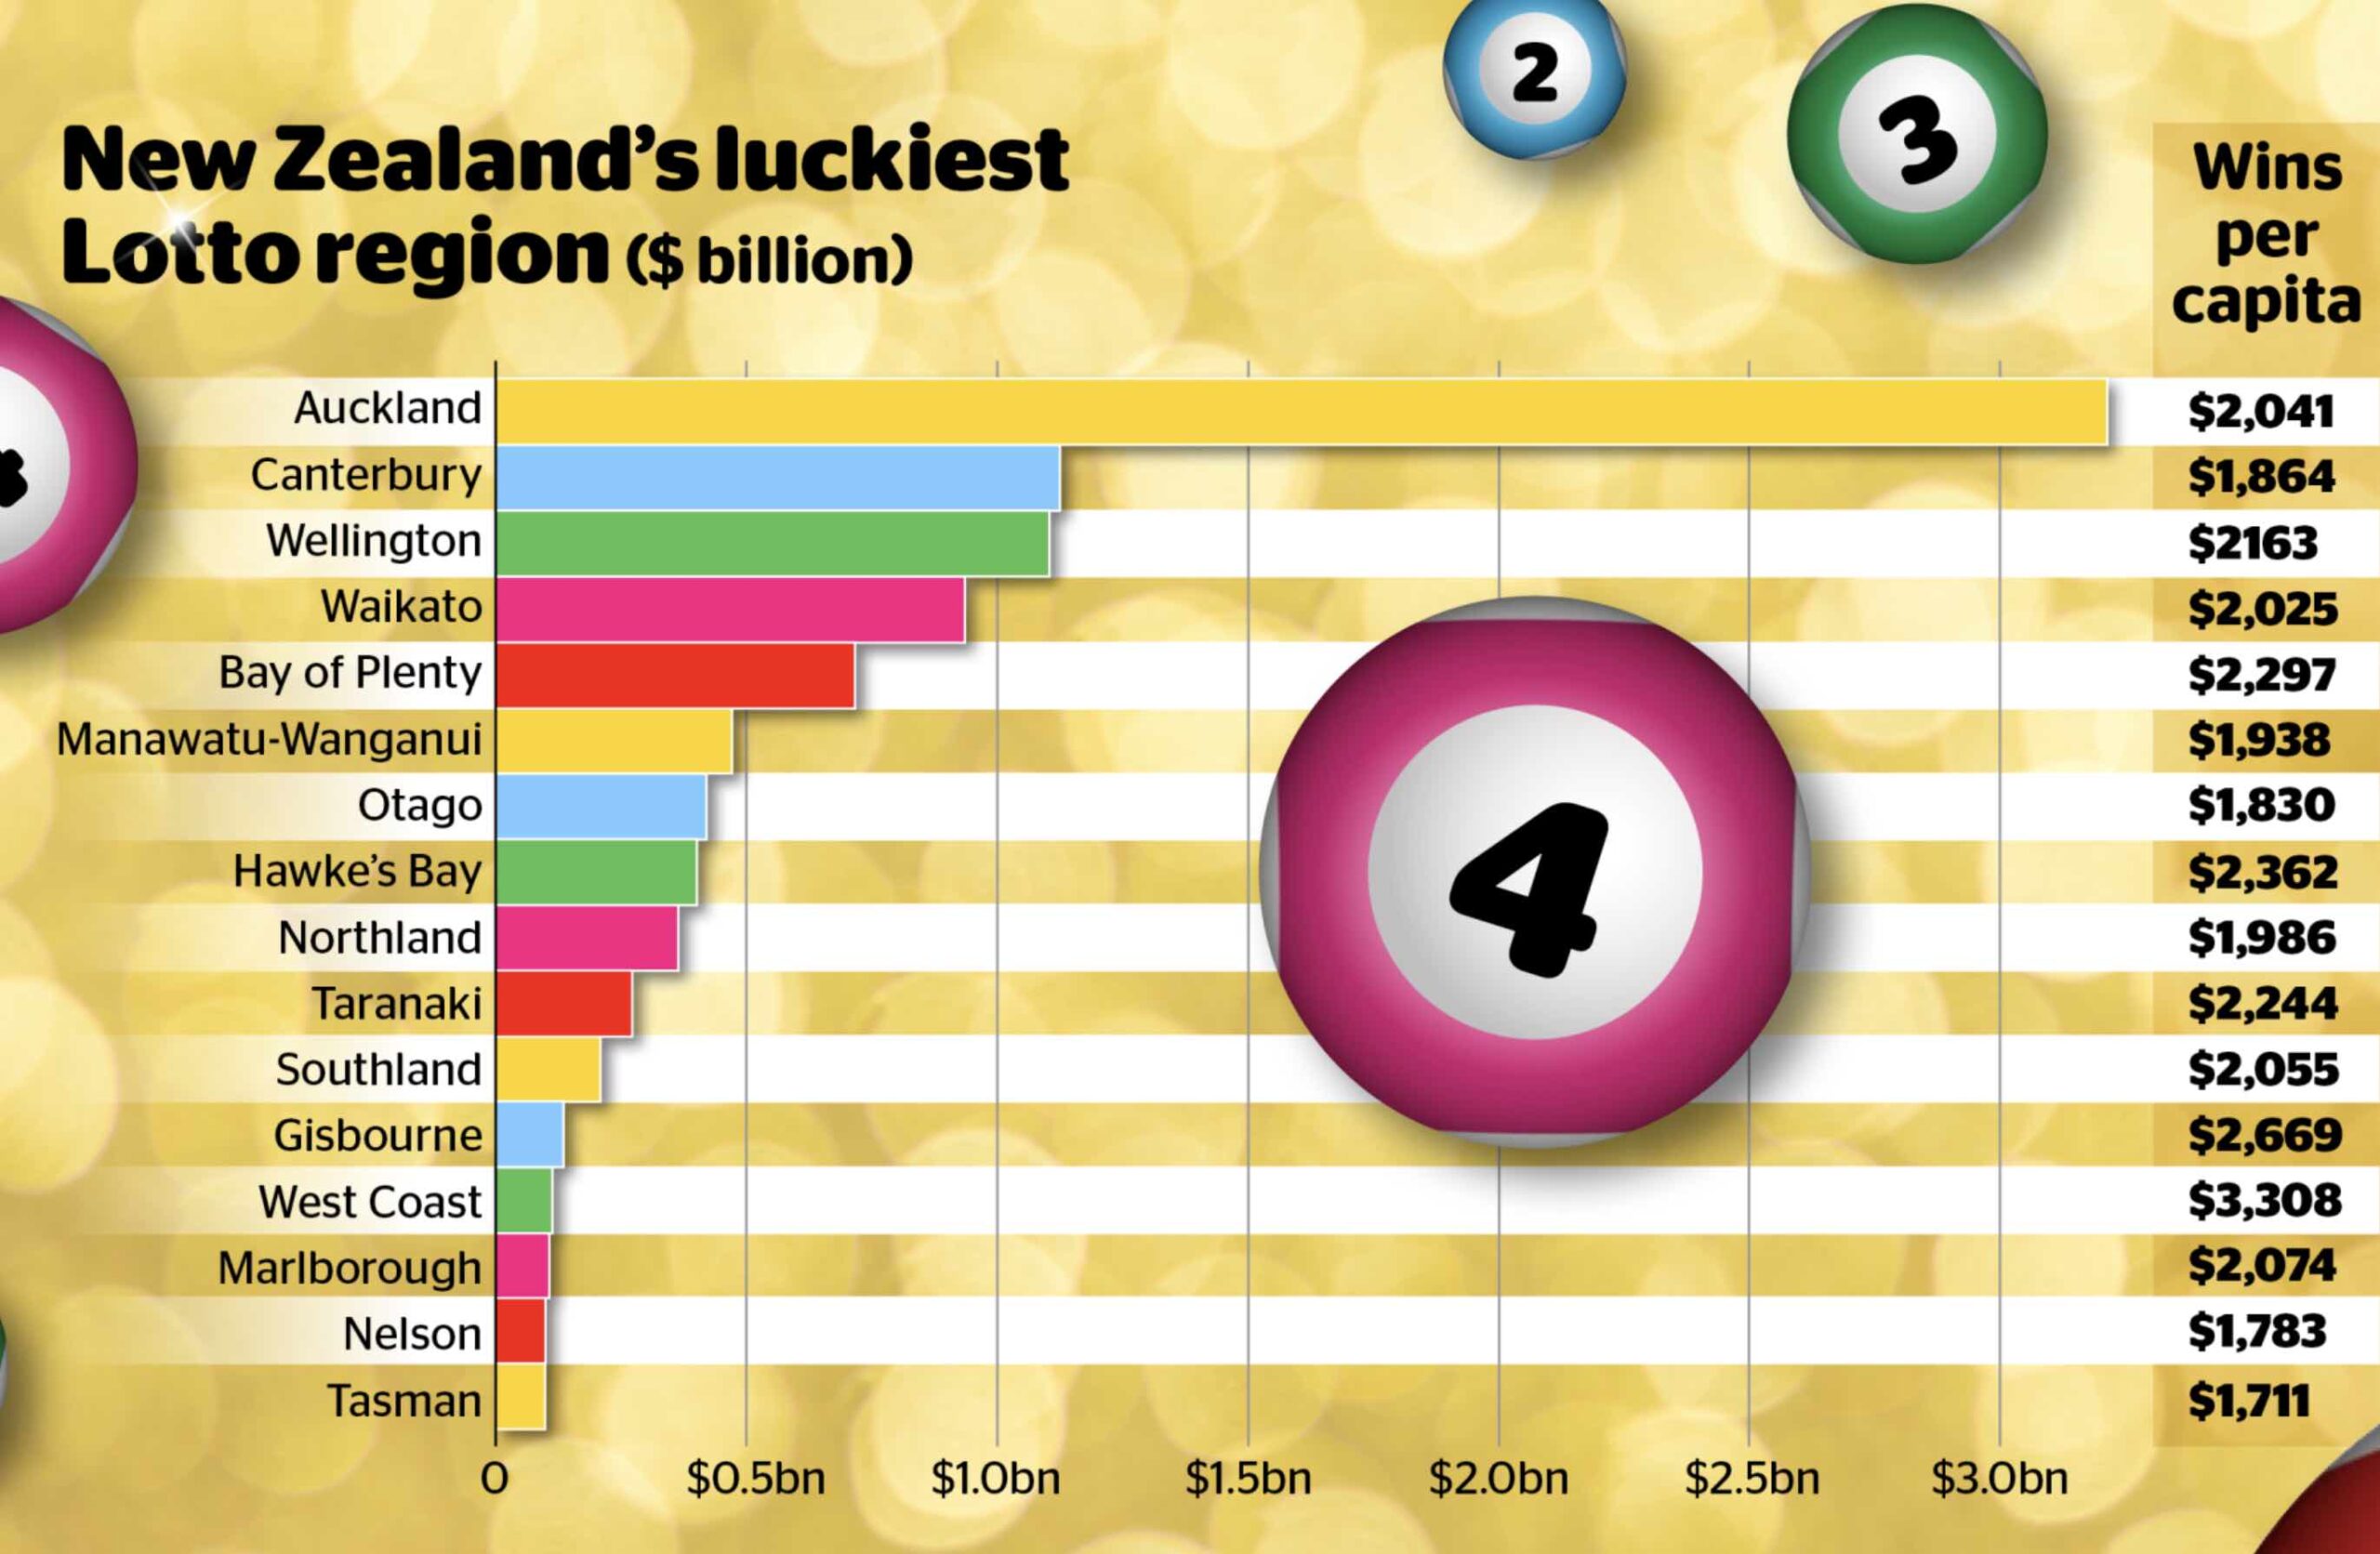
Aucklanders have won more money in Lotto prizes than any other region — roughly three times as much as either Canterbury or Wellington. By an amazing coincidence, Auckland has roughly three times the population of Canterbury or Wellington.  The bar chart is only showing population. Auckland is not punching above its weight.

Wins per capita are over on the side, and are much less variable. Some of this will be that people in different regions play Lotto more or less ofter; some probably was luck. It’s possible that some variation is due to strategy — not variation in whether you win, but in how much.

Perhaps more importantly, the ‘wins per capita’ figure is gross winnings, not net winnings.   Lotto NZ didn’t release details of expenditures, but 2000 draws is a long enough period of time that we can work with averages and get a rough estimate.  As the Herald reports, about 55c in the dollar goes in prizes, so the gross winnings will average about 55% of revenue and the net winnings will average -45% of revenue, or -9/11 times gross winnings.

So: as an estimate over the past 2000 draws, the ‘luckiest’ NZ regions


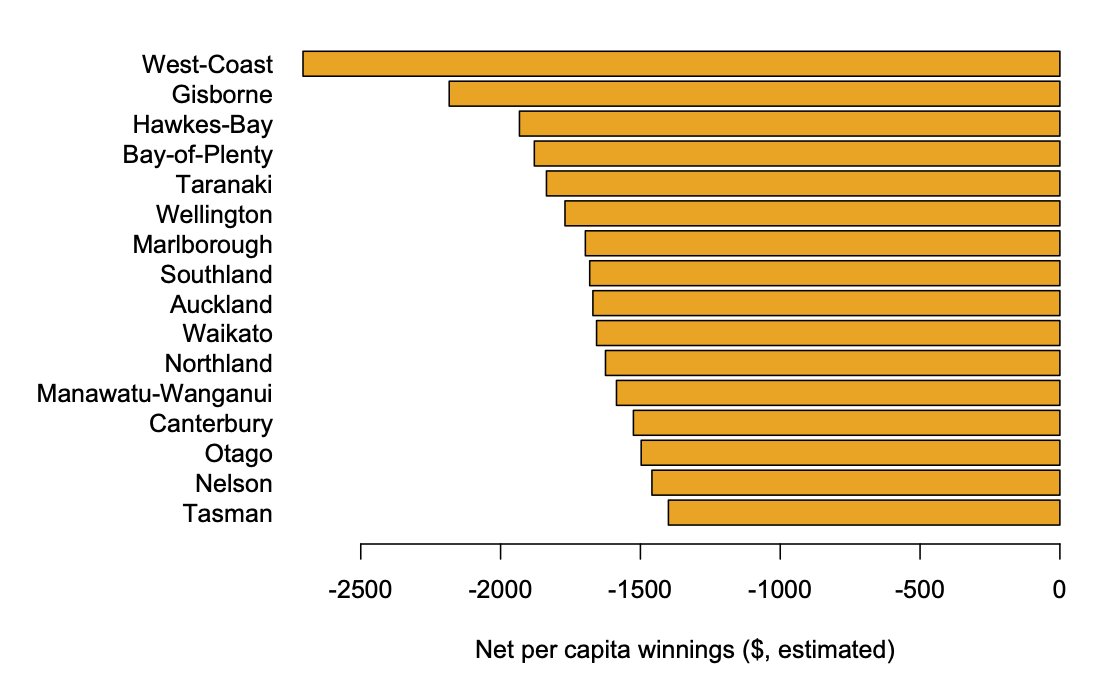
Some of the smaller regions are probably misrepresented here by good/bad luck — if Lotto NZ released actual data on revenue by region I’d be happy to do a more precise version

August 24, 2020

The polling spectrum

I’ve had two people already complain to me on Twitter about the Stickybeak polling at The Spinoff. I’m a lot less negative than they are.

To start with, I think the really important distinction in surveys is between those that are actually trying to get the right answer, and those that aren’t.  Stickybeak are on the “are trying” side.

There’s also a distinction between studies that are really only making an effort to get internally-valid comparisons and those that are trying to match the population.  Internally-valid comparisons can still be useful: if you have a big self-selected internet sample you won’t learn much about what proportion of people take drugs, but you might be able learn how the proportion of cannabis users trying to cut down compares with the proportion of nicotine users trying to cut down, or whether people who smoke weed and drink beer do both at once or on separate days, or other useful things.

Stickybeak are clearly trying to get nationally representative estimates (at least for their overall political polling): they talk about reweighting to match census data by gender, age, and region, and their claimed secret sauce is chatbots to raise response rates for online surveys.

Now, just because you’re trying to get the right answer doesn’t mean you will. There are plenty of people who try to predict Lotto results or earthquakes, too.  And there, it’s too soon to say.  We know that online panels can give good answers: YouGov has done well with this technique, where their respondents are not necessarily representative, but they have a lot of information about them.   We’re also pretty sure that pure random sampling for political opinion doesn’t work any more; response rates are so low that either quota sampling or weighting is needed to make the sample look at all like the population.

So what do I think?  I would have hoped to see more variables used to reweight (ethnicity, and finer-scale geography), with total sample size larger, not smaller, than the traditional polls.  I’d also like to see a better uncertainty description. The Spinoff is quoting

For a random sample of this size and after accounting for weighting the maximum sampling error (using 95% confidence) is approximately ±4%.

The accounting for weighting is not always done by NZ pollsters, so that’s good to see, but ‘For a random sample of this size’ seems a bit evasive.  Either they’re claiming 4% is a good summary of the (maximum) sampling error for their results, in which case they should say so, or they aren’t, in which case they should stop hinting that it is.    Still, we know that the 3.1% error claimed by traditional pollsters is an underestimate, and they largely get a pass on it.

If you want to know whether to trust their results, I can’t tell you. Stickybeak are new enough that we don’t really know how accurate they are.

August 7, 2020

Briefly

  • Newshub has a story about so-called ‘lucky’ Lotto stores.  I’ll recycle a previous response.
  • The Productivity Commission are arguing that the extra week in lockdown was unnecessary and very expensive. Their analysis is wrong; it does not seem to consider whether and how much the extra week reduced the risk of needing a second lockdown, which was part of the reason for doing in.  I’m not saying the extra week was the right decision — you can’t tell, without modelling the extra risk, which they didn’t do.  It’s like saying insurance is not cost-effective because your house didn’t burn done. Insurance may or may not be cost-effective, but that isn’t how you tell.
  • Ed Yong at the Atlantic, on why there’s so much we don’t know about COVID immune response: Immunology Is Where Intuition Goes to Die
  • The Human Gene Nomenclature Committee has changed the names of a bunch of genes. Not because they’re named after unpleasant historical figures, but because Excel keeps trying to turn them into dates:  SEPT1, OCT4, MARCH1.  Spreadsheets are useful (and Excel is the world’s most popular statistical software), but you do need to keep a sharp eye on them
  • Newshub reports on an attempt to get Pharmac to pay for a drug that costs half a million dollars per patient per year.  I’ll outsource the basic statistical comparison to Matt Nippert on Twitter — the total cost would be about a quarter of Pharmac’s budget (and I’ll just note that this is slightly more than it spends on cancer.)
  • If you thought our Census had problems, look at the US.  The American Statistical Association and the American Association for Public Opinion Research are among the groups who want the data collection extended rather than shortened.
March 5, 2018

Briefly

  • The gender gap: JP Morgan claims to pay its women employees 99% of what the men get. Felix Salmon and Matt Levine both take on this statistic: it doesn’t show women are paid the same (they aren’t), it just argues against one particular mechanism for the pay gap.
  • “Starting with no knowledge at all of what it was seeing, the neural network had to make up rules about which images should be labeled “sheep”. And it looks like it hasn’t realized that “sheep” means the actual animal, not just a sort of treeless grassiness.” Janelle Shane.
  • Translation is another example of the amazingly-good results networks can get, but with no grip on what’s actually going on. Douglas Hofstatder writes at the Atlantic about “The Shallowness of Google Translate“, and Mark Liberman at Language Log shows how it will translate random sequences of vowels into Hawaiian gibberish.
  • David Spiegelhalter on how to stop being so easily manipulated by misleading statistics
  • Tickets bought online for NZ Lotto are more likely to win. It’s obvious that there has to be a boring explanation for this. I suggested one that fitted the data.
October 30, 2017

Past results do not imply future performance


A rugby team that has won a lot of games this year is likely to do fairly well next year: they’re probably a good team.  Someone who has won a lot of money betting on rugby this year is much less likely to keep doing well: there was probably luck involved. Someone who won a lot of money on Lotto this year is almost certain to do worse next year: we can be pretty sure the wins were just luck. How about mutual funds and the stock market?

Morningstar publishes ratings of mutual funds, with one to five stars based on past performance. The Wall Street Journal published an article saying (a) investors believe these are predictive of future performance and (b) they’re wrong.  Morningstar then fought back, saying (a) we tell them it’s based on past performance, not a prediction and (b) it is, too, predictive. And, surprisingly, it is.

Matt Levine (of Bloomberg; annoying free registration) and his readers had an interesting explanation (scroll way down)

Several readers, though, proposed an explanation. Morningstar rates funds based on net-of-fee performance, and takes into account sales loads. And fees are predictive. Funds that were good at picking stocks in the past will, on average, be average at picking stocks in the future; funds that were bad at picking stocks in the past will, on average, be average at picking stocks in the future; that is in the nature of stock picking. But funds with low fees in the past will probably have low fees in the future, and funds with high fees in the past will probably have high fees in the future. And since net performance is made up of (1) stock picking minus (2) fees, you’d expect funds with low fees to have, on average, persistent slightly-better-than-average performance.

That’s supported by one of Morningstar’s own reports.

The expense ratio and the star rating helped investors make better decisions. The star rating and expense ratios were pretty even on the success ratio–the closest thing to a bottom line. By and large, the star ratings from 2005 and 2008 beat expense ratios while expense ratios produced the best success ratios in 2006 and 2007. Overall, expense ratios outdid stars in 23 out of 40 (58%) observations.

A better data analysis for our purposes would look at star ratings for different funds matched on fees, rather than looking at the two separately.  It’s still a neat example of how you need to focus on the right outcome measurement. Mutual fund trading performance may not be usefully predictable, but even if it isn’t, mutual fund returns to the customer are, at least a little bit.


November 7, 2016

The Powerball jackpot: what are the odds

The chance of winning Powerball on a usual Lotto draw is fairly easy to calculate: you need pick 6 numbers correctly out of 40, and the powerball number correctly out of 10. The number of possible combinations is 3,838,380×10=38,383,800, so your chance is 1 in 38,383,800.  Buying 10 combinations twice a week, you’d get a perfect match a bit more than once every 37,000 years.

On Saturday, the prize was $38 million dollars. If tickets were $1 or less, the big prize would pay for buying all 38 million combinations — and the expected value of even smaller numbers of tickets would be more than they cost.  However, tickets cost $1.20 per “line” ($0.60 for the six numbers, $0.60 for the Powerball), so you’d  still lose money on average with each ticket you buy.

‘Must Win’ jackpots like the one on Wednesday are different.  The $40 million prize has to go, so the expected prize value per “line” is $40 million divided by the number of lines sold.  Unfortunately, we don’t know what that number is.  For the last ‘Must Win’ jackpot there were 2.7 million tickets sold, but we don’t know how many lines that represents; the most popular ticket has 10.

It looks like the expected value of tickets for this draw might be positive.  However ‘expected value’ is a technical term that’s a bit misleading in English: it’s the average (mean) of a lot of small losses and a few big wins.  Almost everyone who buys tickets for Wednesday’s draw will miss out on the big prize — the ‘averages’ don’t start averaging out until you buy millions of tickets. Still, your chances are probably better than in usual weeks.

October 30, 2016

Briefly

  • A long post on the use and misuse of the ‘Twitter firehose’, from Bloomberg View
  • A long story at Stuff about discharge without conviction, though a bit undermined by the fact that, as the story says, “[the] number of discharges without conviction has plummeted, from 3189 in 2011, to 2103 in 2015,
  • While the idea of  predicting the US election using mako sharks (carchariamancy?) is no sillier than psychic meerkats or lucky lotto retailers, I don’t think the story really works unless the people pushing it at least pretend to believe it.
  • On the other hand, some people did seriously argue that shark attacks affected the results of presidential elections. And were wrong
May 4, 2016

Should you have bet on Leicester City?

As you know, Leicester City won the English Premier League this week. At the start of the season, you could get 5000:1 odds on this happening. Twelve people did.

Now, most weeks someone wins NZ Lotto first division, which pays more than 5000:1 for a winning ticket, and where we know the odds are actually unfavourable to the punter. The 5000:1 odds on their own aren’t enough to conclude the bookies had it wrong.  Lotto is different because we have good reasons to know that the probabilities are very small, based on how the numbers are drawn. With soccer, we’re relying on much weaker evidence.

Here’s Tim Gowers explaining why 5000:1 should have been obviously too extreme

The argument that we know how things work from following the game for years or even decades is convincing if all you want to prove is that it is very unlikely that a team like Leicester will win. But here we want to prove that the odds are not just low, but one-in-five-thousand low.

Professor Gowers does leave half the question unexamined, though

I’m ignoring here the well-known question of whether it is sensible to take unlikely bets just because your expected gain is positive. I’m just wondering whether the expected gain was positive.


December 31, 2015

One of those end of year post thingies

The most obvious thing in the StatsChat logs: the Rugby World Cup:

rugby

Also, back last January, there was a study on the relationship between cell divisions and cancer risk across human tissues. The popular misinterpretations of the research — “cancer is mostly bad luck” — led to our most popular post ever.

The question of what it means for something to be a Group I carcinogen gets us a lot of low-level traffic, but interest peaked after the IARC report on red meat and processed meat.

Posts on the risk posed by foreign drivers were popular early in the year. In July, though, they were displaced by foreign-sounding home buyers.

I wrote about the largest human randomised controlled trial of mānuka honey to prevent illness, when it was reported in June. It was done by kids at a London primary school. They didn’t find a benefit.

Finally, there’s a steady trickle of people interested in the mathematics of the lottery, presumably in the mistaken hope that we’ll tell them how to beat the martingale optional sampling theorem.

October 16, 2015

Not the news

I was surprised to see a headline in the Business section of the Herald saying “2015 luckiest year for Lotto players” about lotto jackpots (story here)

lotto-ad

After all, the way the lottery jackpots work, the amount paid out is a fixed fraction of the amount taken in. If there are more people winning large amounts then either the large amounts aren’t as large as in other years, or it’s because more people are collectively losing large amounts. Lotto players, considered individually, can be lucky or not; lotto players conside collectively, can’t be.

If you look carefully, though, you can see this isn’t a news story. It’s a “Sponsored Story”.

This still seems different from the “Brand Insight” that “connects readers directly to the leadership thinking of many prominent companies and organisations“, or the science and technology column by Michelle ‘Nanogirl’ Dickinson that was initially sponsored by Callaghan Innovation.