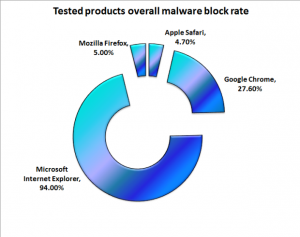
Pie charts with 110% awfulness
Pie charts, as you may have noticed, are not very popular among statisticians, despite the best efforts of the world’s most popular statistics package. Pie charts with fake 3D are much worse, since the 3-D effects make it harder to see the numbers they can be actively misleading. But the worst form of pie chart must be the one that gives up on the ‘pie’ metaphor and shows numbers that aren’t even shares of a total.
Stat-of-the-Week nominator Mark points us to this example:
from an otherwise-reasonable post at TechRepublic, on malware-blocking by internet browsers (though it could have done with some consideration of false positives and absolute risk).
The numbers are taken from a report by a professional security lab, but the graphic design is new and original. The report had an inoffensive bar chart, which makes the point much more clearly
Thomas Lumley (@tslumley) is Professor of Biostatistics at the University of Auckland. His research interests include semiparametric models, survey sampling, statistical computing, foundations of statistics, and whatever methodological problems his medical collaborators come up with. He also blogs at Biased and Inefficient See all posts by Thomas Lumley »

