Three maps
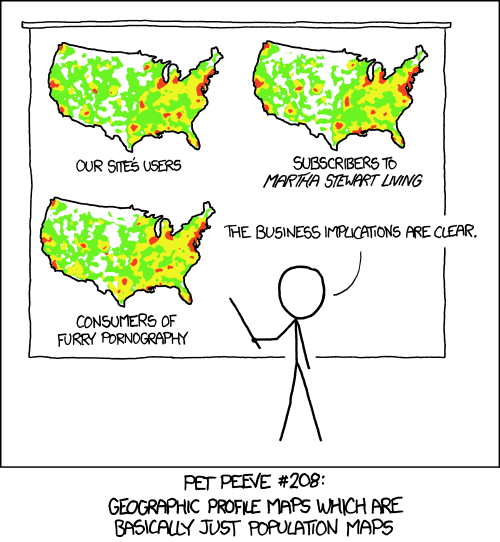
US GDP, measured by locations of businesses, from Reddit user atrubetskoy
Now, GDP isn’t really well-defined at that sort of spatial scale — employees and businesses and customers need not all live in the same small census area — and the data are old, but it still looks striking.
However, in this map, the orange areas have 50% of the US population
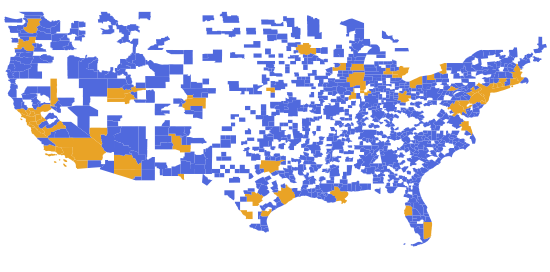
and since I used whole cities/counties as units, the orange areas could be made a lot smaller with a bit of effort, giving a better approximation to the GDP map.
Thomas Lumley (@tslumley) is Professor of Biostatistics at the University of Auckland. His research interests include semiparametric models, survey sampling, statistical computing, foundations of statistics, and whatever methodological problems his medical collaborators come up with. He also blogs at Biased and Inefficient See all posts by Thomas Lumley »