August 22, 2014
California drought visualisation
From XKCD. Both the data and the display technique are worth looking at
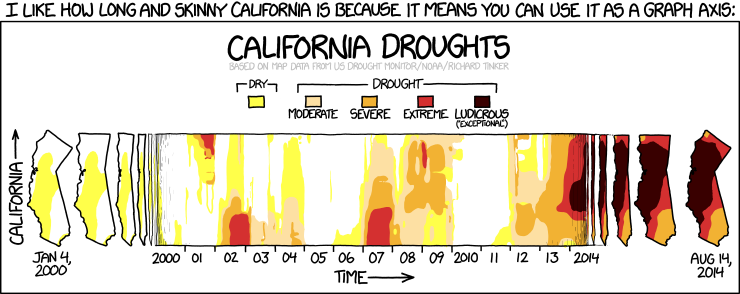
Presumably you could do something similar with New Zealand, which is roughly the same shape.
Thomas Lumley (@tslumley) is Professor of Biostatistics at the University of Auckland. His research interests include semiparametric models, survey sampling, statistical computing, foundations of statistics, and whatever methodological problems his medical collaborators come up with. He also blogs at Biased and Inefficient See all posts by Thomas Lumley »