Of droughts and flooding rains
Australia’s climate is weird, even in the relatively habitable bits such as Melbourne, so it makes for interesting graphs. This is going to be another post about aspect ratios and alignment in graphs and how to use them for things other than lying with statistics.
The data are from Melbourne Water, the percentage full for Melbourne’s water storage since August 1984 when the (enormous) Thompson Dam came on line.
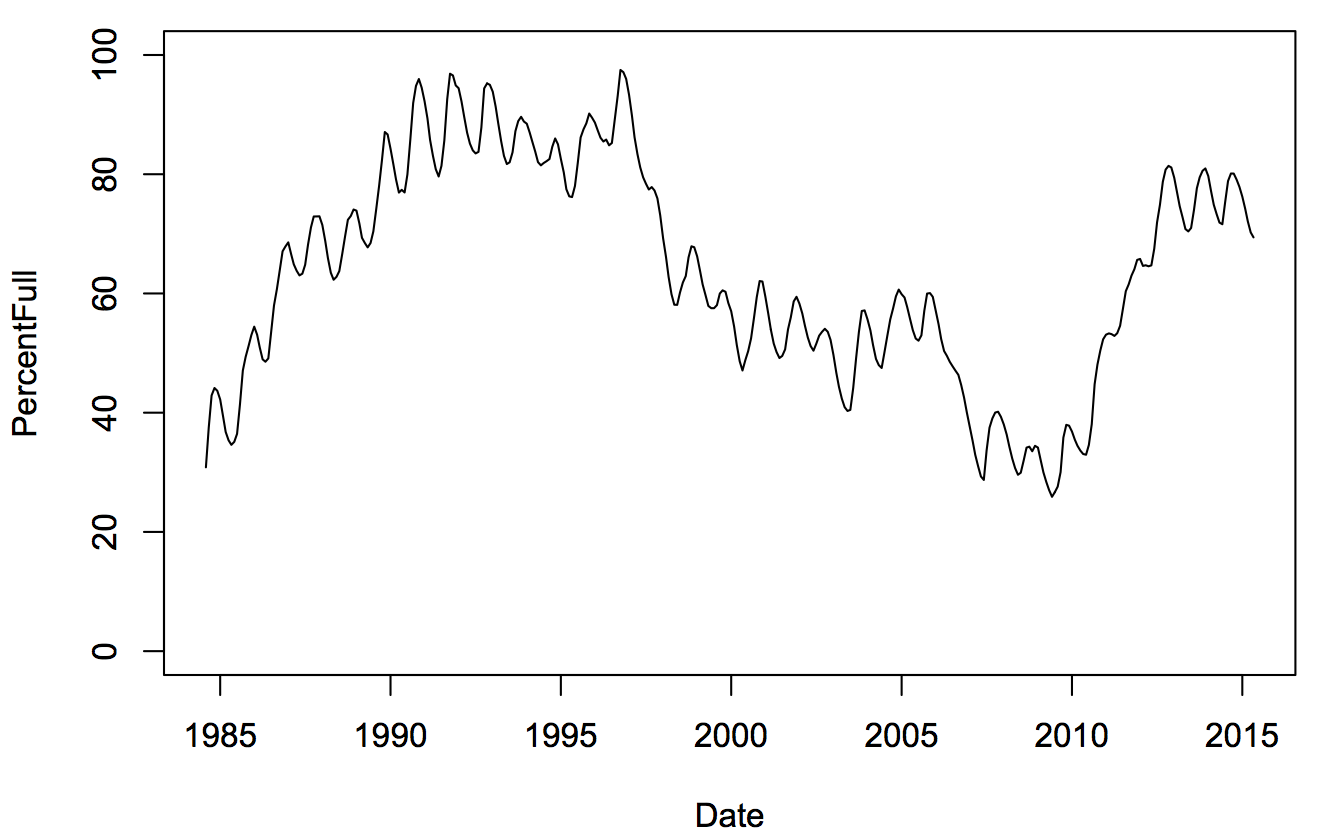
The year-to-year variation is hugely bigger than the seasonal variation. This isn’t an artifact of the measurements or the graph; there really was a ten-plus year drought that was just temporary and is now (temporarily) over.
It’s easy to see the shape of the long-term variation in this graph, but hard to see the shape of the seasonal variation. Stretching out the graph helps: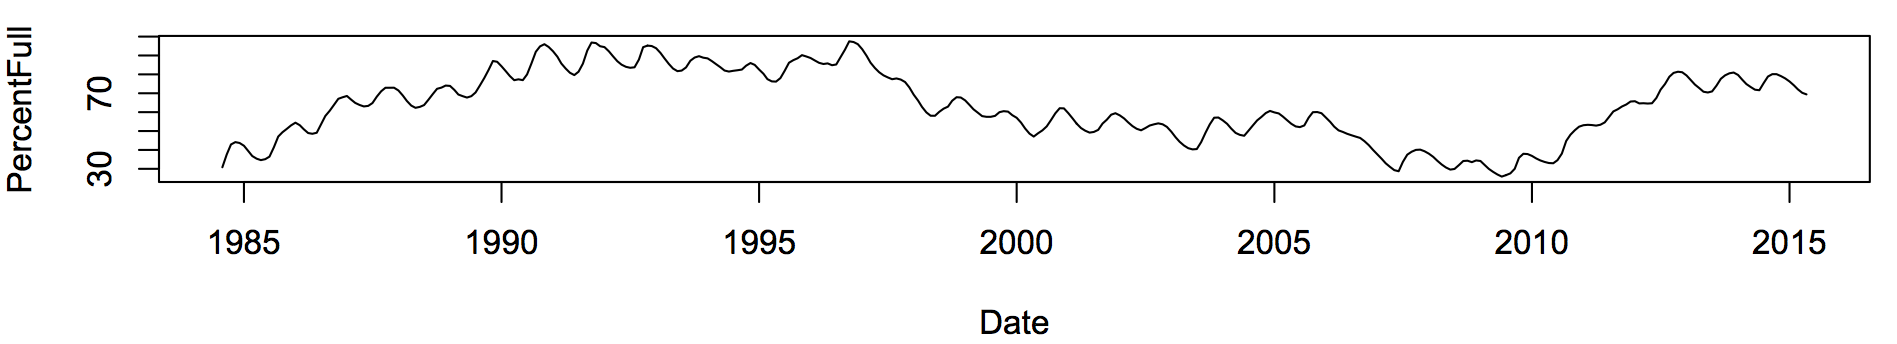
It’s now harder to see the long-term variation, but you can see the storage fills up fast and empties more slowly (in most years).
Usually, a good, simple way to see seasonal patterns is just to stack the years:
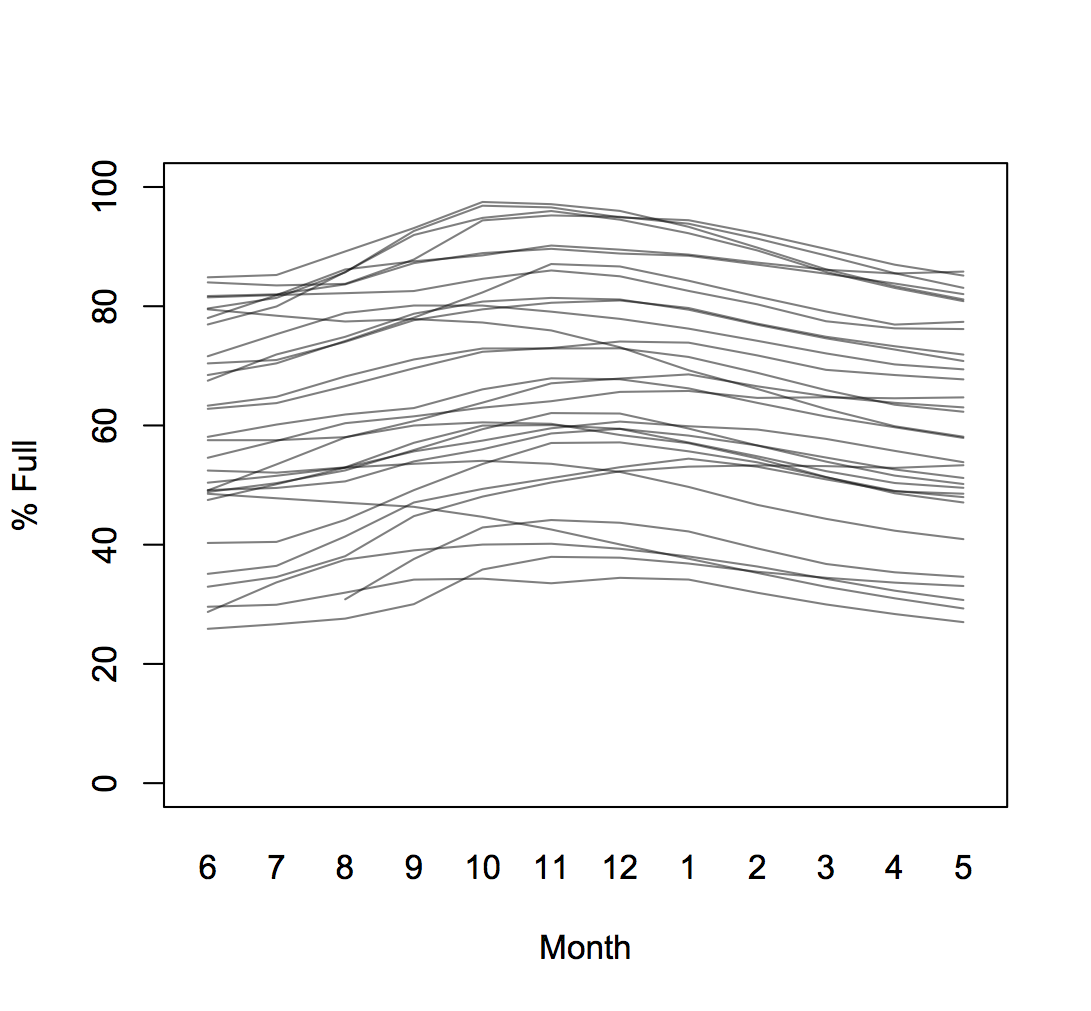
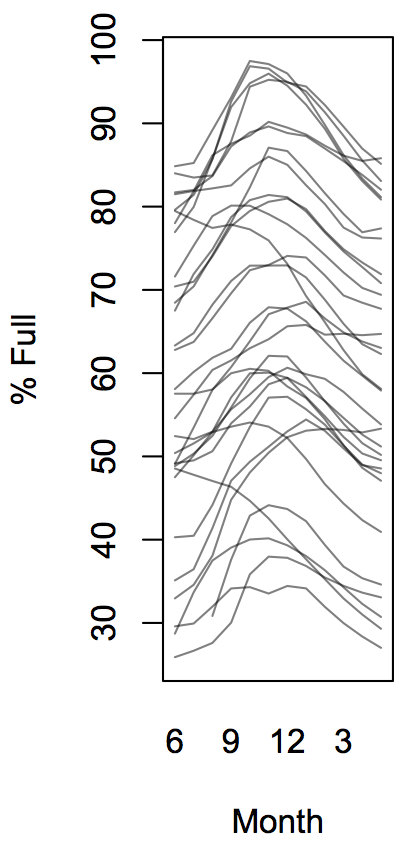
In this case, the year-to-year variation swamps the pattern we’re trying to see. One approach is to squash the graph sideways. This helps a lot, but it’s an inconvenient shape
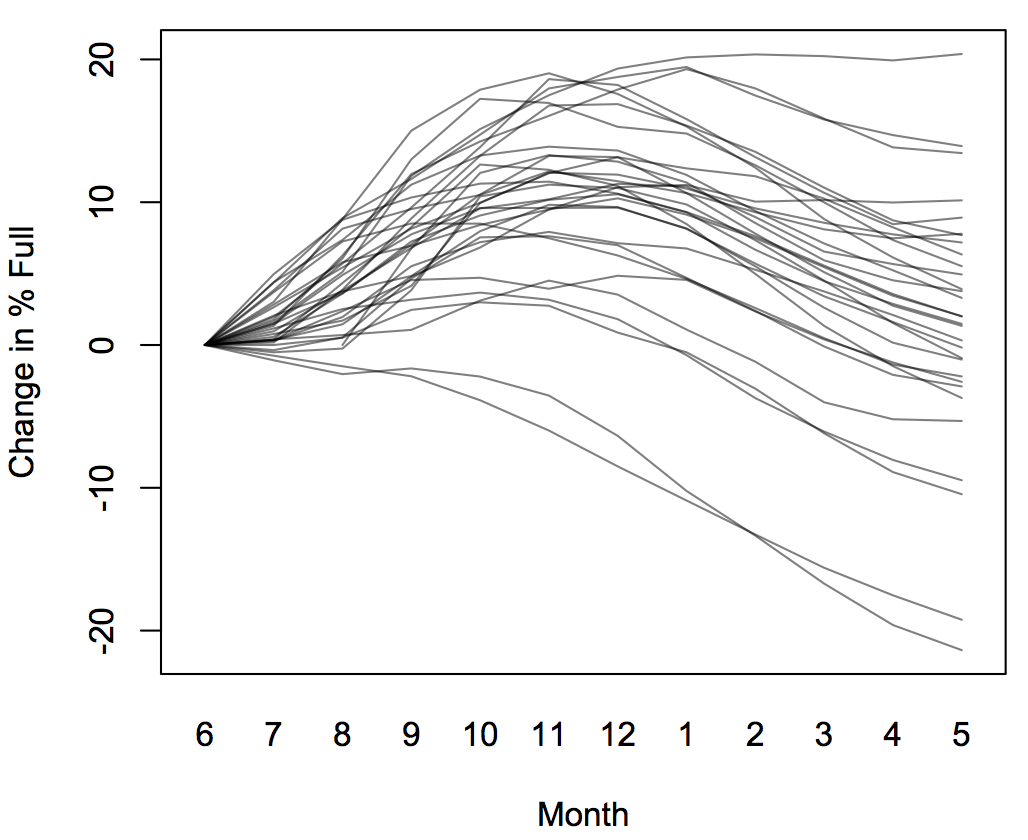
We could also recenter each year’s data to reduce the visual spread, perhaps so each year starts off at the same level
or subtracting off the average for the year, so that the years are all centered at the same place
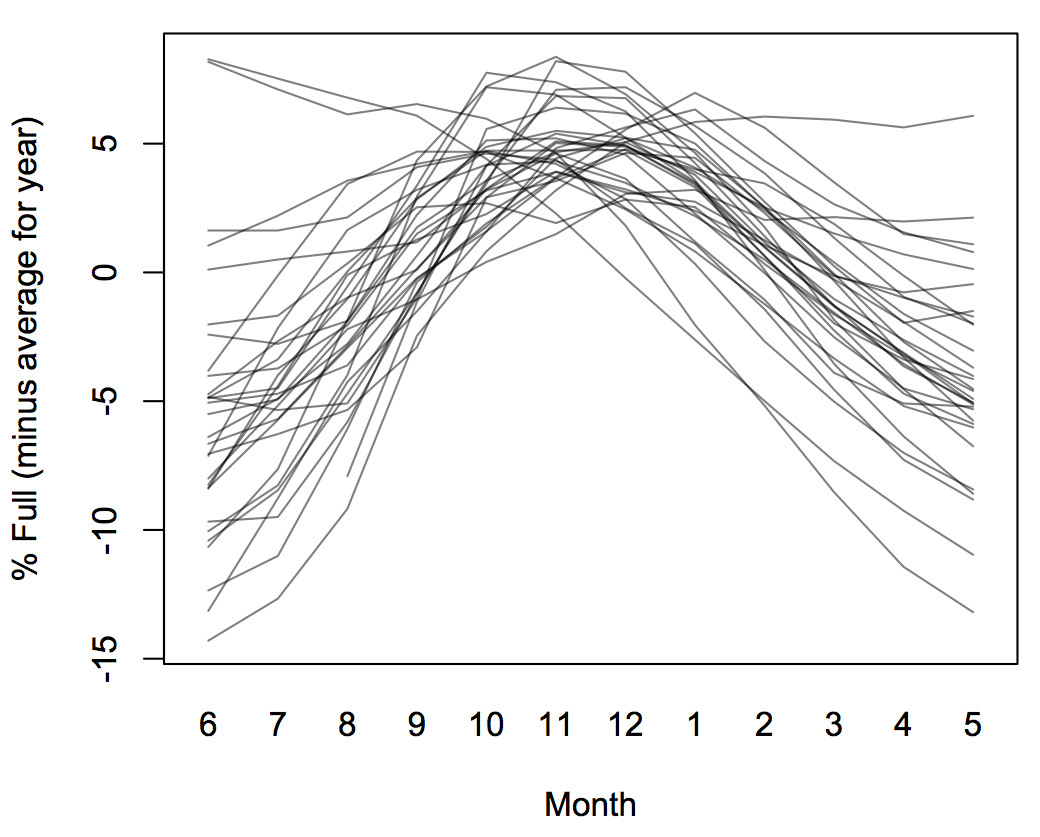
These are all very different graphs of a simple one-variable data set. The question isn’t which one is right, but which one displays the aspect of the data you are interested in.
What the data do illustrate, more or less however you display them, is the very low signal-to-noise ratio for climate trends in Australia. That, in addition to the obvious reasons, contributes to Australia having less climate-change awareness than you might expect given its other politics.
Thomas Lumley (@tslumley) is Professor of Biostatistics at the University of Auckland. His research interests include semiparametric models, survey sampling, statistical computing, foundations of statistics, and whatever methodological problems his medical collaborators come up with. He also blogs at Biased and Inefficient See all posts by Thomas Lumley »