An interesting thing about the referendum
The referendum preliminary results are in, and as you’d expect, there is a substantial majority for “No”, but it’s also substantially smaller than the number who voted National at the last election. Everyone will be able to say the results support their own views, so I won’t bother.
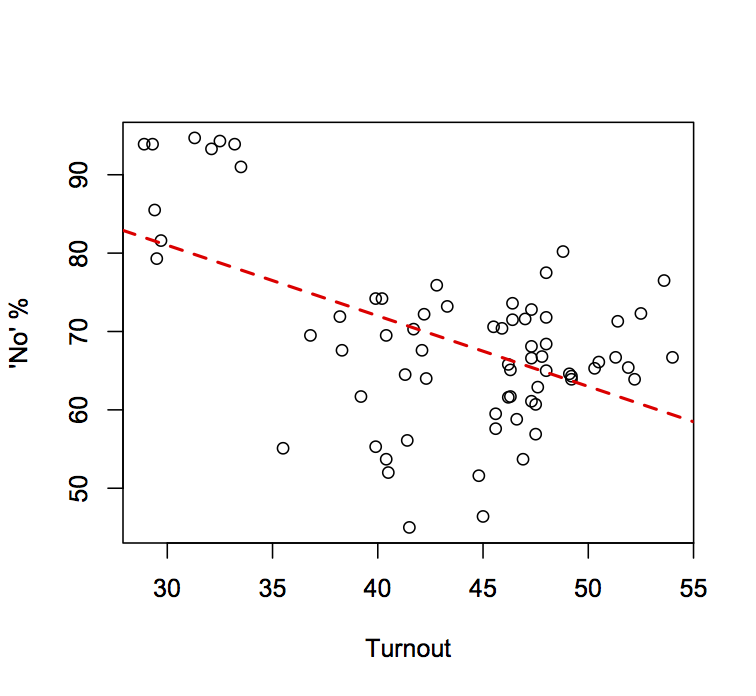
What is interesting is the relationship between turnout and vote. Before going further, think about what you’d expect.
I would have expected people who disapproved of asset sales to be more likely to vote, since the referendum was initiated by people who disapproved of asset sales. In one way the electorate-level preliminary results supporting that expectation: the “No” vote had a majority essentially everywhere. But on the other hand, at the electorate level, electorates with a higher response rate had a lower “No” vote. As with the overall result, you could spin this either way, but I still think it’s interesting
Two cheers to the Electoral Office, for getting the results out so quickly in both HTML and Excel (but only two cheers, because the numbers were all messed up with commas and percentage signs and couldn’t be analysed directly).
[Update: Ok. So Eric Crampton has convinced me that this is qualitatively what you’d expect from what I’d call Berkson’s Paradox. That is, voters are a mixture of the sort of people who just vote given any opportunity and the people who really hate asset sales. Electorates with more of the former will have more votes and a lower ‘no’ fraction. I still think it’s a surprisingly strong trend in quantitative terms. ]
More update: The cluster in the top left is interesting. It’s a combination of the seven Maori-roll electorates and three South Auckland general-roll electorates. If we treat the cluster separately the correlation is positive in both components.
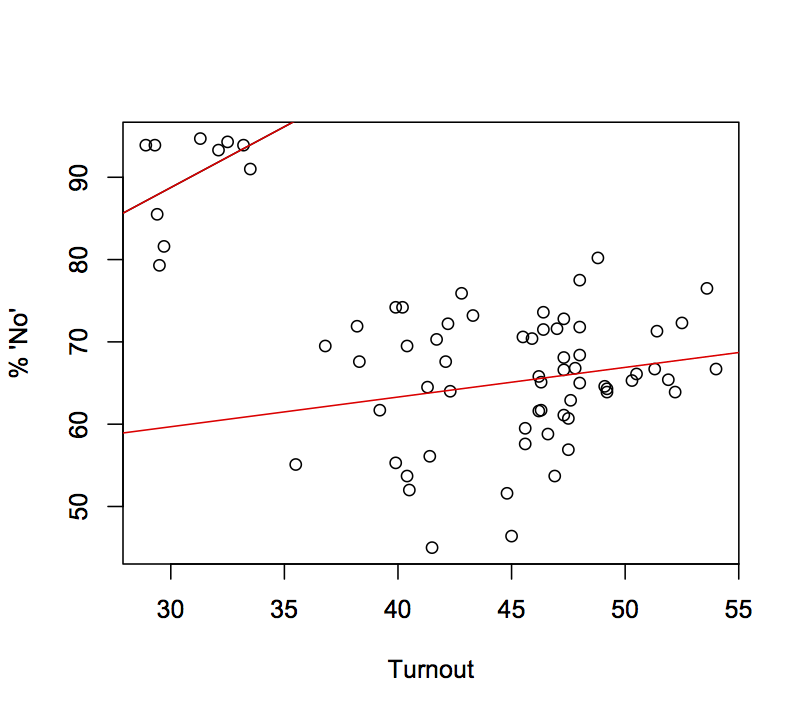
so whatever your explanation was for the previous relationship, you need to rethink it.
One more update: There isn’t a clear picture in “No” vote by income, but it’s a bit more interesting looking at it grouped by turnout
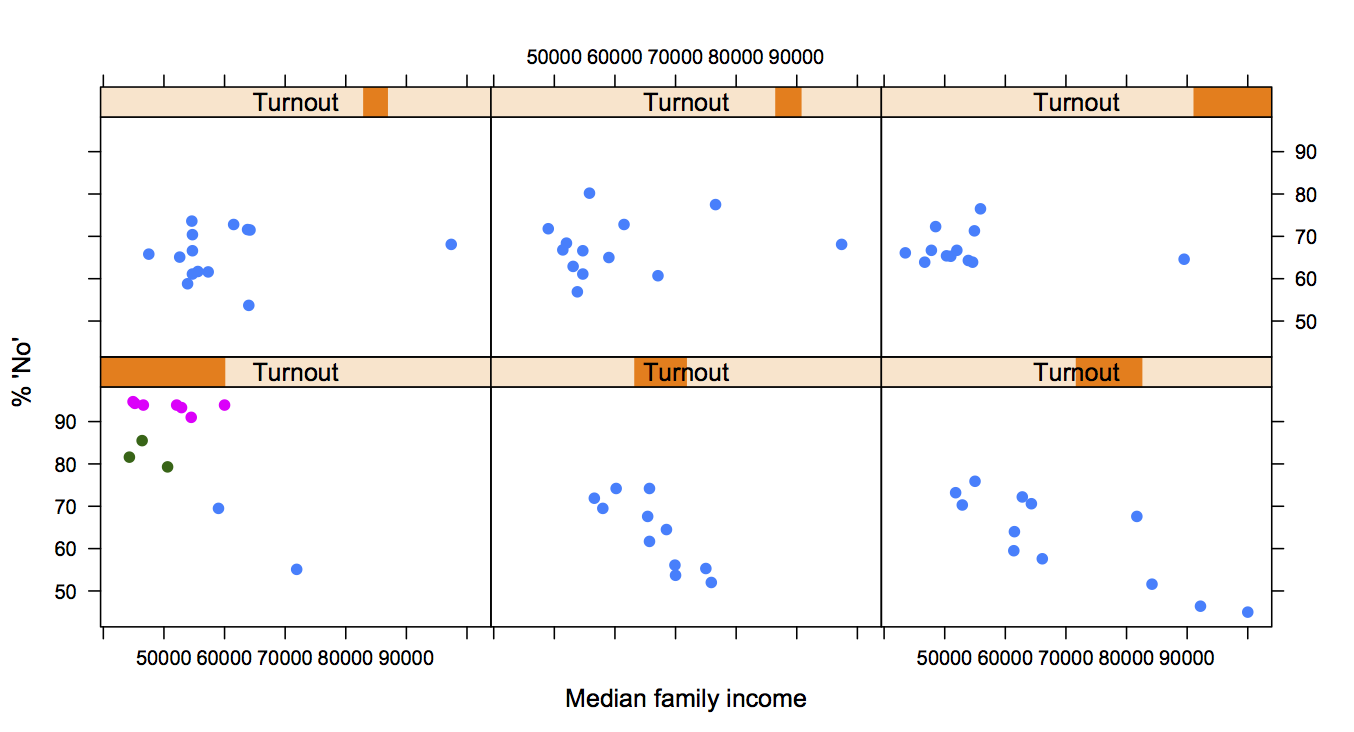
Each panel is a graph of “% No” by median family income, for different ranges of turnout, as shown in the header strips. There’s quite a strong relationship in the low-turnout electorates, but in the high-turnout ones the vote is pretty much independent of median income. The colours indicate three clusters: the 7 Maori electorates, 3 electorates in South Auckland with high Pacific population, and the rest.
[In addition to people mentioned, thanks to Keith Ng, Phillip Lyth, David Farrar, Peter Green, for helpful twittering]
Thomas Lumley (@tslumley) is Professor of Biostatistics at the University of Auckland. His research interests include semiparametric models, survey sampling, statistical computing, foundations of statistics, and whatever methodological problems his medical collaborators come up with. He also blogs at Biased and Inefficient See all posts by Thomas Lumley »
How about plotting NZDep by proportion voting no.
13 years ago
I’d have to find the data at electorate scale and that would be work. Maybe later.
13 years ago
Out of interest, what are the three electorates in the three higher turnout categories that have around $90k median household income.
(I know Epsom and Remmers voted <50% for "no" so I can identify them.)
13 years ago
The full data is at http://faculty.washington.edu/tlumley/ref-keith.txt where I put it for Keith Ng to play with.
13 years ago
North Shore
Ohariu and
Wellington Central
Hmm, it doesn’t bode well for Peter Dunne given the pct yes was 35% on a turnout of 49%.
13 years ago
I did not vote but if I did I’d have voted no because I support the sale of 100% of the assets not 49%. I think the question was flawed anyway.
13 years ago
I’d bet fairly substantial sums that less than 1% of voters were in any honest doubt about the intended meaning and thought it was a question about 49% vs 100%.
13 years ago
I too found the question frustrating, seeing it as five separate questions, and then I didn’t have the motivation to actually remember to vote.
13 years ago
I do rate it as the best referendum question I’ve voted on so far, although that’s not a high bar to cross.
13 years ago
Unsurprisingly, there’s negative correlation between electorate support for National and ACT (in 2011’s election) and voting “No” (nice straight line, R-squared about 0.92). The model is roughly
No = 100% – 0.67(N+A)%.
When you fit this line, then almost all of the South Island electorates stand out as those with less support for asset sales than you’d expect for their level of National+ACT support. (“No” votes are 3% higher than you’d expect from the model in the Mainland).
13 years ago
I heard your comment on National Radio saying that a higher % of people who were against assets sales would vote than those who supported thems.
I suggest that this statement is without evidence, which is odd coming from a statistician. If there is evidence – tell me about it. If there is no evidence (or not enough evidence to suggest it) then it would have been better left unsaid.
13 years ago
I actually said it could go either way, but that my opinion was the bias would be in favour of “No”. I can’t see what stronger evidence that this is indeed my opinion could be presented apart from my saying it on National radio. If you want to know why it’s my opinion, the main reason is that the Nationals were dismissing the referendum as a publicity stunt and the “No” campaign was saying it was an important chance to be heard, and because I think people are more likely to vote if they want to change something rather than to stick with the status quo.
This does go to illustrate the main point I was making, which is that non-binding referenda are inferior to both binding referenda (where this sort of issue doesn’t matter, because the vote is the vote) and to well-conducted random samples (where you do get to find out which side has the majority).
13 years ago
In case anyone cares: I voted ‘No’ and I think there’s probably majority opposition to the sales. I just don’t think the referendum gives us much additional data.
13 years ago