May 2, 2014
Excellent display of sampling error by New York Times
To help with interpreting trends in unemployment, the New York Times has two animated bar charts showing the impact of sampling uncertainty. Here’s a snapshot of one of them (click for the real thing)
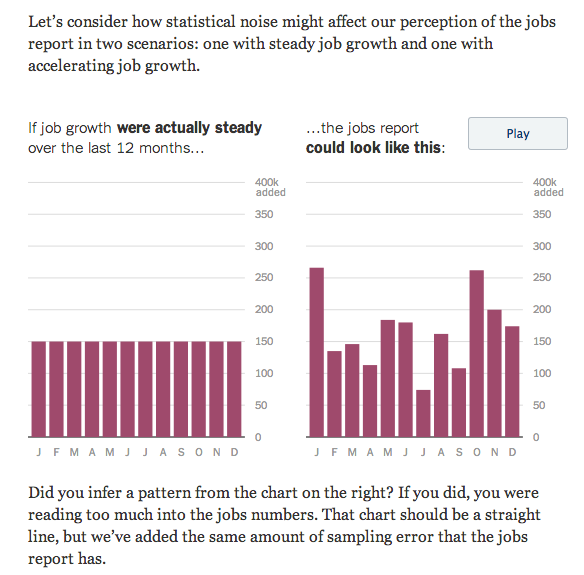
There’s a lot of uncertainty in ‘job growth’ figures from a single month, and a lot more uncertainty in month to month changes in estimates of job growth.
Thomas Lumley (@tslumley) is Professor of Biostatistics at the University of Auckland. His research interests include semiparametric models, survey sampling, statistical computing, foundations of statistics, and whatever methodological problems his medical collaborators come up with. He also blogs at Biased and Inefficient See all posts by Thomas Lumley »