Misleading maps
This map, from Reddit, shows the most common name in each county of England and Wales in 1881, based on the 1881 census.
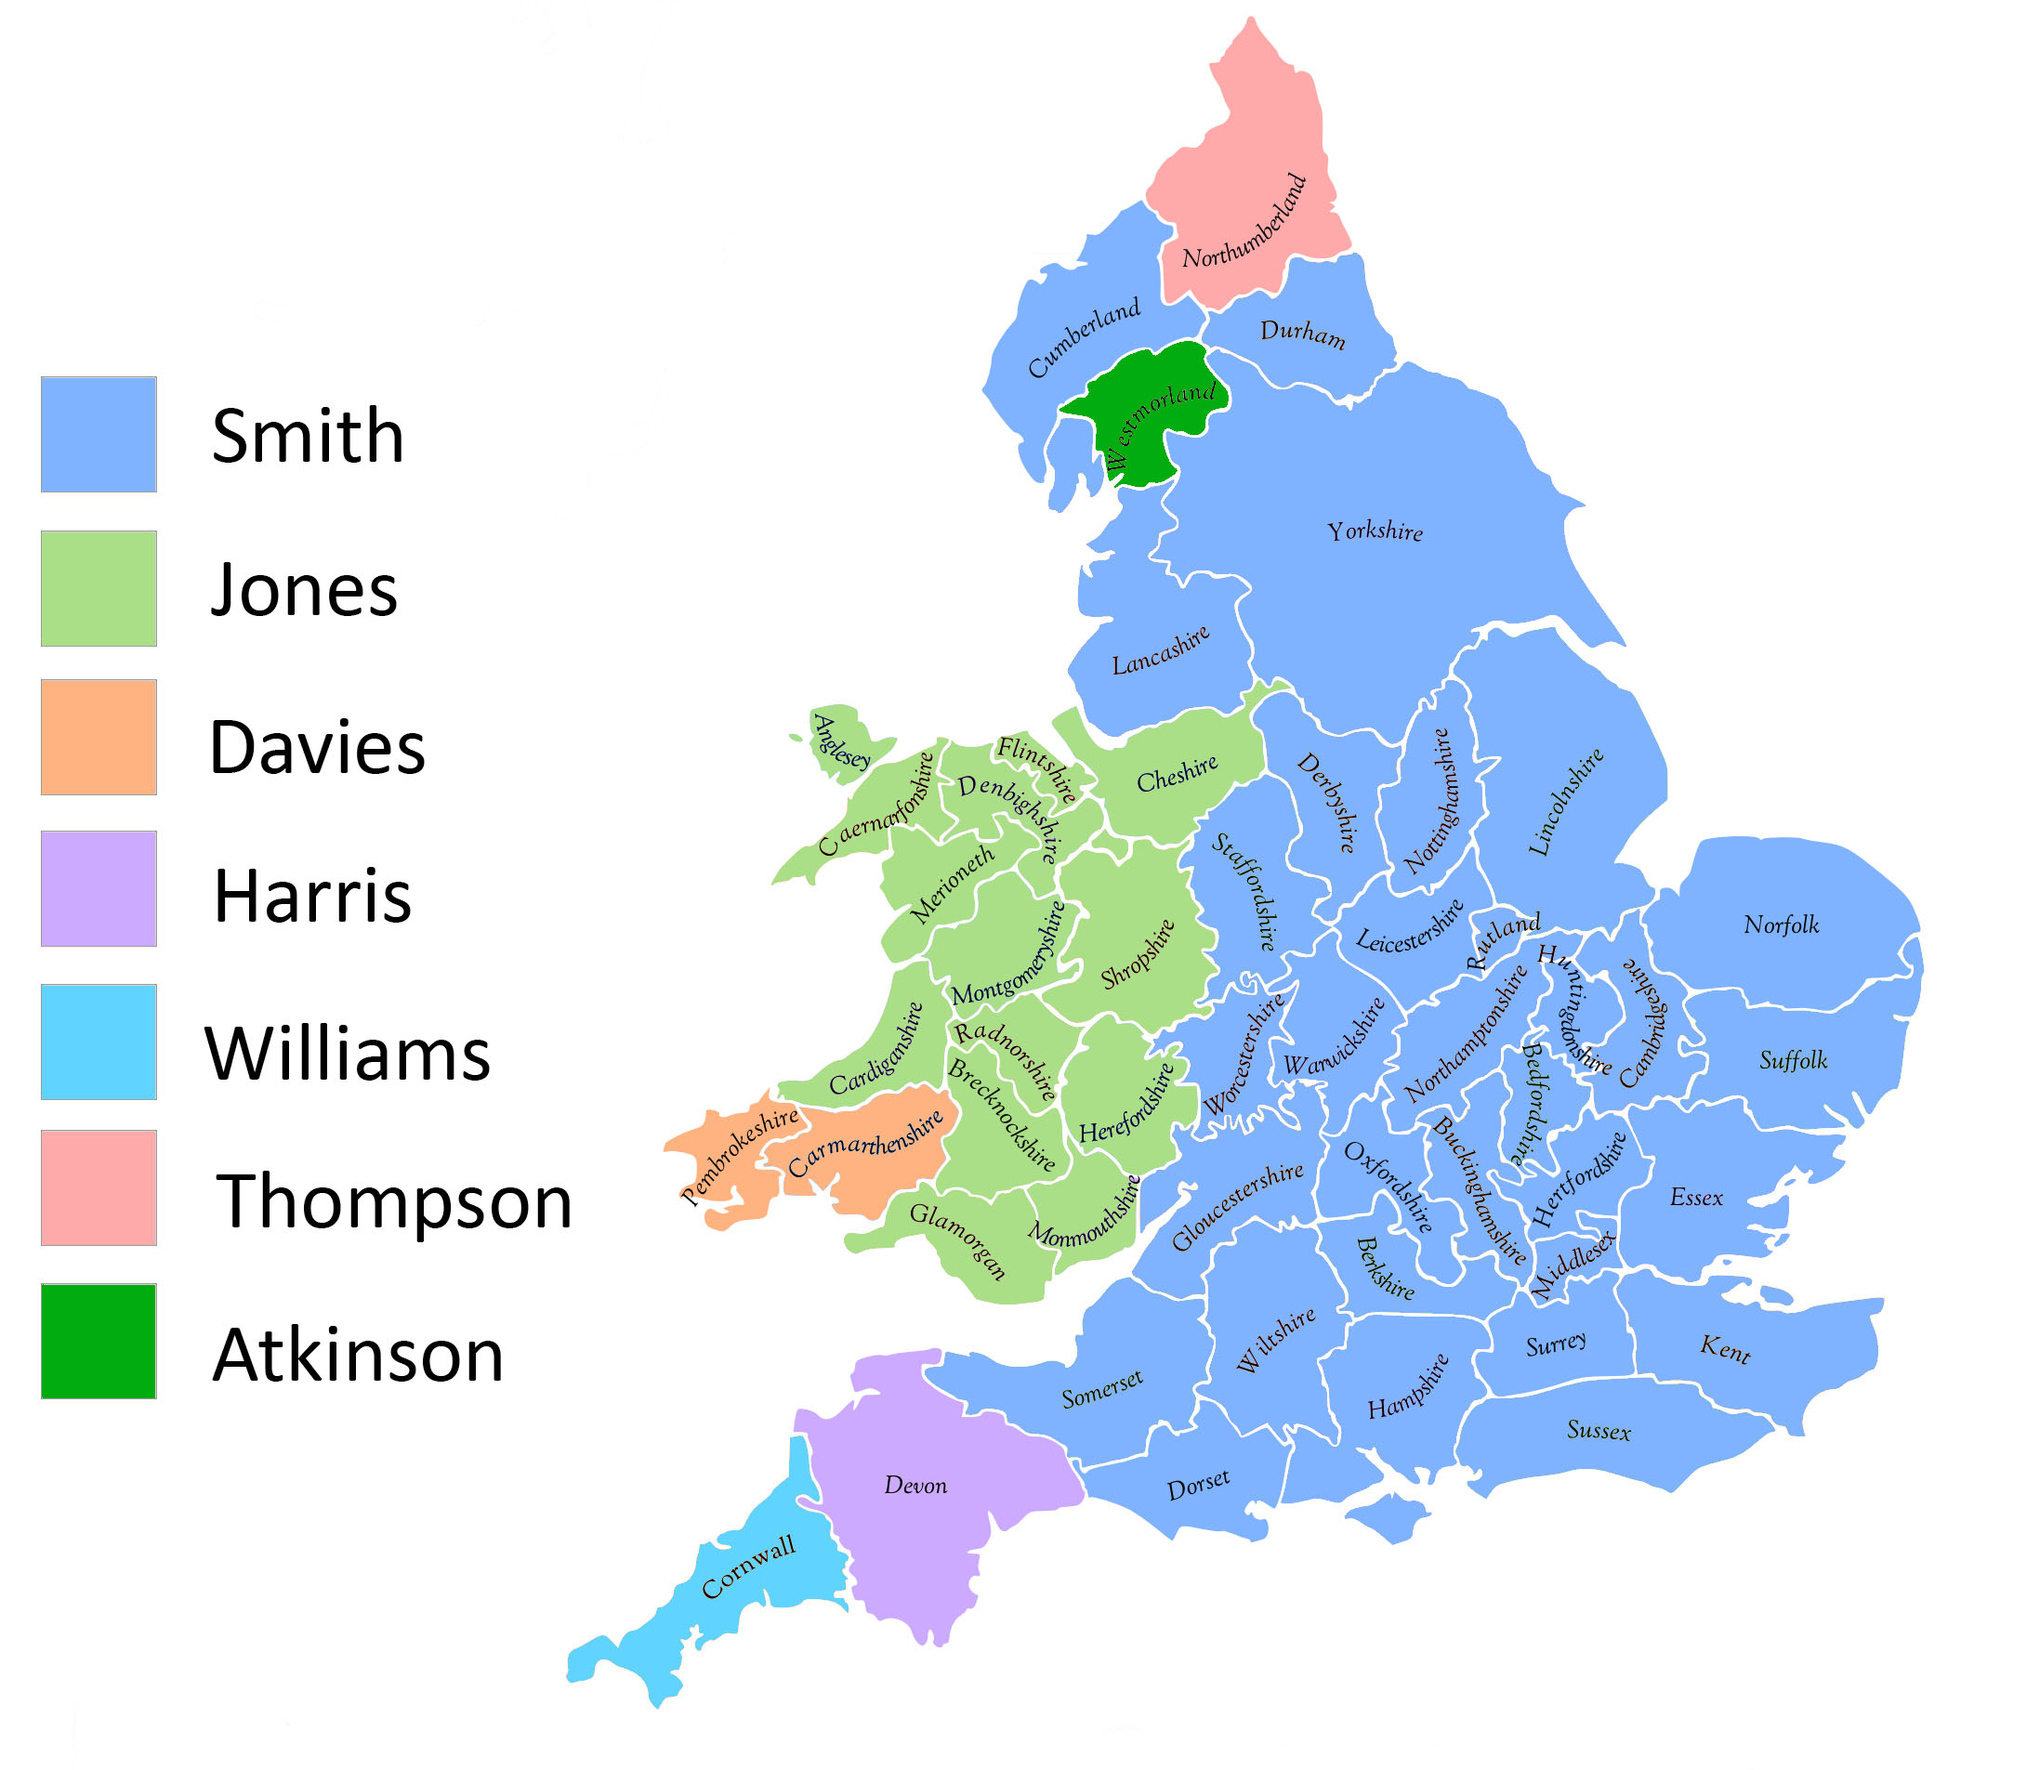
Matthew Yglesias at Vox.com says “what’s remarkable is how nearly perfectly the Smith/Jones divide lines up with the political boundary between England and Wales”. I think it’s remarkable that he think’s it’s remarkable — I think of ‘Jones’ as the stereotypical Welsh name — but obviously associations are different in the US. It is worth pointing out that the line-up isn’t as good as you might think if you weren’t careful: three of the light-green counties are actually in England, not in Wales.
Yglesias also says that the names “seem to show pretty distinctively what part of the British Isles your male line hails from.” That’s an example of how maps are systematically misleading — the conclusion may be true, but the map doesn’t support it as strongly as it seems to. The map shows the most common name in each county, and most of the counties where Jones is the most common name are Welsh. However, that doesn’t mean most people called Jones were in Wales. In fact, based on search counts from UKCensusOnline.com, Lancashire had more Joneses than any Welsh county, and London had more than all but two Welsh counties. Overall, only 51% of Joneses were in Wales, going up to 60% if you include the three English counties coloured light green on the map.
In this particular case, many non-Welsh Joneses probably did have Welsh ancestors who had left Wales well before 1881, but not all of them — according to Wikipedia, the name came from Norman French and the first recorded use was in England.
Thomas Lumley (@tslumley) is Professor of Biostatistics at the University of Auckland. His research interests include semiparametric models, survey sampling, statistical computing, foundations of statistics, and whatever methodological problems his medical collaborators come up with. He also blogs at Biased and Inefficient See all posts by Thomas Lumley »