Seeing the margin of error
A detail from Andrew Chen’s visualisation of all the election polls in NZ:
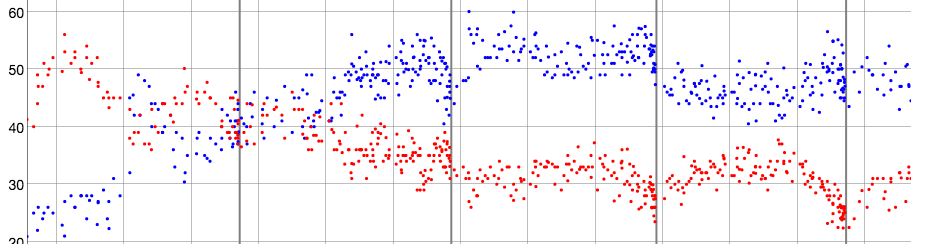
His full graph is somewhat interactive: you can zoom in on times, select parties, etc. What I like about this format is how clear it makes the poll-to-poll variability. The poll result for, say, National isn’t a line, it’s a cloud of uncertainty.
The cloud of uncertainty gets narrower for minor parties (as detailed in my cheatsheet), but for the major parties you can see it span an entire 10-percentage-point grid cell or more.
Thomas Lumley (@tslumley) is Professor of Biostatistics at the University of Auckland. His research interests include semiparametric models, survey sampling, statistical computing, foundations of statistics, and whatever methodological problems his medical collaborators come up with. He also blogs at Biased and Inefficient See all posts by Thomas Lumley »