Posts filed under Polls (132)

September 7, 2018

Election polling experiment

From the New York Times

For the first time, we’ll publish our poll results and display them in real time, from start to finish, respondent by respondent. No media organization has ever tried something like this, and we hope to set a new standard of transparency. You’ll see the poll results at the same time we do. You’ll see our exact assumptions about who will turn out, where we’re calling and whether someone is picking up. You’ll see what the results might have been had we made different choices.

December 15, 2017

Public comments, petitions, and other self-selected samples

In the US, the Federal Communications Commission was collecting public comments about ‘net neutrality’ — an issue that’s commercially and politically sensitive in a country where many people don’t have any real choice about their internet provider.

There were lots of comments: from experts, from concerned citizens, from people who’d watched a John Oliver show. And from bots faking real names and addresses on to automated comments.   The Wall Street Journal contacted a random sample of nearly 3000 commenters and found the majority of those they could get in contact with had not submitted the comment attached to their details.  The StartupPolicyLab attempted to contact 450,000 submitters, and got a response from just over 8000. Of the 7000 contacted about pro-neutrality comments, nearly all agreed they had made the comment, but of the 1000 responses about anti-neutrality comments, about 88% said they had not made the comment.

It’s obviously a bad idea to treat the comments as a vote. Even if the comments were from real US people, with one comment each, you’d need to do some sort of modelling of the vast majority who didn’t comment.  But what are they good for?

One real benefit is for people to provide ideas you hadn’t thought of.  The public comment process on proposed New Zealand legislation certainly allows for people like Graeme Edgeler to point out bugs in the drafting, and for people whose viewpoints were not considered to speak out.  For this, it doesn’t matter what the numbers of comments are, for and against. In fact, it helps if people who don’t have something to say don’t say it.

With both petitions and public comments there’s also some quantitative value in showing that concern about some issue you weren’t worrying about isn’t negligibly small; that thousands (in NZ) or hundreds of thousands (in the US) care about it.

But if it’s already established that an issue is important and controversial, and you care about the actual balance of public opinion, you should be doing a proper opinion poll.

November 15, 2017

Bogus poll headlines justified

The Australian postal survey on marriage equality was a terrible idea.

It was a terrible idea because that sort of thing shouldn’t be a simple majority decision.

It was a terrible idea because it wasn’t even a vote, just a survey.

It was a terrible idea because it wasn’t even a good survey, just a bogus poll.

As I repeatedly say, bogus polls don’t tell you anything much about people who didn’t vote, and so they aren’t useful unless the number voting one particular way is a notable proportion of the whole eligible population. In the end, it was.

A hair under 50% of eligible voters said ‘Yes’, just over 30% said ‘No’, and about 20% didn’t respond.

And, in what was not at all a pre-specified hypothesis, Tony Abbott’s electoral division of Warringah had an 84% participation rate and 75% ‘Yes’, giving 63% of all eligible voters indicating ‘yes’.


PS: Yay!

October 22, 2017

Bogus-poll headlines

The headline:

Kiwis want cannabis legalised – Herald Facebook poll

And in the text

An unscientific poll run on the NZ Herald Facebook page shows that the majority of New Zealanders want to see cannabis legalised.

The poll doesn’t show anything of the sort, because bogus polls can’t show anything of the sort.

According to the story there were about 15,500 ‘yes’ responses. A bogus poll doesn’t tell you anything about people who didn’t participate. Even if we knew these were different people and all New Zealanders, it would still be just under half a percent of, say, enrolled voters.

It was just a few months ago that Nicholas Jones in the Herald reported a real poll, which asked a more detailed set of questions and tried to sample a representative group of people.  That adds information to the debate. Headlines based on bogus polls subtract information.

September 24, 2017

The polls

So, how did the polls do this time? First, the main result was predicted correctly: either side needs a coalition with NZ First.

In more detail, here are the results from Peter Ellis’s forecasts from the page that lets you pick coalitions.

Each graph has three arrows. The red arrow shows the 2014 results. The blue/black arrow pointing down shows the current provisional count and the implied number of seats, and the horizontal arrow points to Graeme Edgeler’s estimate of what the special votes will do (not because he claims any higher knowledge, but because his estimates are on a web page and explain how he did it).

First, for National+ACT+UnitedFuture

national

Second, for Labour+Greens

labgrn

The result is well within  the uncertainty range of the predictions for Labour+Greens, and not bad for  National. This isn’t just because NZ politics is easy to predict: the previous election’s results are much further away. In particular, Labour really did gain a lot more votes than could reasonably have been expected a few months ago.


Update: Yes, there’s a lot of uncertainty. And, yes, that does  mean quoting opinion poll results to the nearest 0.1% is silly.

September 20, 2017

Democracy is coming

Unless someone says something really annoyingly wrong about polling in the next few days, I’m going to stop commenting until Saturday night.

Some final thoughts:

  • The election looks closer than NZ opinion polling is able to discriminate. Anyone who thinks they know what the result will be is wrong.
  • The most reliable prediction based on polling data is that the next government will at least need confidence and supply from NZ First. Even that isn’t certain.
  • It’s only because of opinion polling that we know the election is close. It would be really surprising if Labour didn’t do a lot better than the 25% they managed in the 2014 election — but we wouldn’t know that without the opinion polls.


September 10, 2017

Why you can’t predict Epsom from polls

The Herald’s poll aggregator had a bit of a breakdown over the Epsom electorate yesterday, suggesting that Labour had a chance of winning.

Polling data (and this isn’t something a statistician likes saying) is essentially useless when it comes to Epsom, because neither side benefits from getting their own supporters’ votes. National supporters are a clear majority in the electorate. If they do their tactical voting thing properly and vote for ACT’s David Seymour, he will win.  If they do the tactical voting thing badly enough, and the Labour and Green voters do it much better, National’s Paul Goldsmith will win.

Opinion polls over the whole country don’t tell you about tactical voting strategies in Epsom. Even opinion polls in Epsom would have to be carefully worded, and you’d have to be less confident in the results.

There isn’t anywhere else quite like Epsom. There are other electorates that matter and are hard to predict — such as Te Tai Tokerau, where polling information on Hone Harawira’s popularity is sparse — but in those electorates the polls are at least asking the right question.

Peter Ellis’s poll aggregator just punts on this question: the probability of ACT winning Epsom is set at an arbitrary 80%, and he gives you an app that lets you play with the settings. I think that’s the right approach.

July 30, 2017

What are election polls trying to estimate? And is Stuff different?

Stuff has a new election ‘poll of polls’.

The Stuff poll of polls is an average of the most recent of each of the public political polls in New Zealand. Currently, there are only three: Roy Morgan, Colmar Brunton and Reid Research. 

When these companies release a new poll it replaces their previous one in the average.

The Stuff poll of polls differs from others by giving weight to each poll based on how recent it is.

All polls less than 36 days old get equal weight. Any poll 36-70 days old carries a weight of 0.67, 70-105 days old a weight 0.33 and polls greater than 105 days old carry no weight in the average.

In thinking about whether this is a good idea, we’d need to first think about what the poll is trying to estimate and about the reasons it doesn’t get that target quantity exactly right.

Officially, polls are trying to estimate what would happen “if an election were held tomorrow”, and there’s no interest in prediction for dates further forward in time than that. If that were strictly true, no-one would care about polls, since the results would refer only to the past two weeks when the surveys were done.

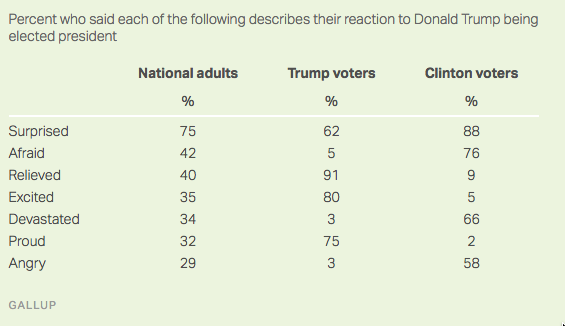
A poll taken over a two-week period is potentially relevant because there’s an underlying truth that, most of the time, changes more slowly than this.  It will occasionally change faster — eg, Donald Trump’s support in the US polls seems to have increased after James Comey’s claims about Clinton’s emails in the US, and Labour’s support in the UK polls increased after the election was called — but it will mostly change slower. In my view, that’s the thing people are trying to estimate, and they’re trying to estimate it because it has some medium-term predictive value.

In addition to changes in the underlying truth, there is the idealised sampling variability that pollsters quote as the ‘margin of error’. There’s also larger sampling variability that comes because polling isn’t mathematically perfect. And there are ‘house effects’, where polls from different companies have consistent differences in the medium to long term, and none of them perfectly match voting intentions as expressed at actual elections.

Most of the time, in New Zealand — when we’re not about to have an election — the only recent poll is a Roy Morgan poll, because  Roy Morgan polls more much often than anyone else.  That means the Stuff poll of polls will be dominated by the most recent Roy Morgan poll.  This would be a good idea if you thought that changes in underlying voting intention were large compared to sampling variability and house effects. If you thought sampling variability was larger, you’d want multiple polls from a single company (perhaps downweighted by time).  If you thought house effects were non-negligible, you wouldn’t want to downweight other companies’ older polls as aggressively.

Near an election, there are lots more polls, so the most recent poll from each company is likely to be recent enough to get reasonably high weight. The Stuff poll is then distinctive in that it complete drops all but the most recent poll from each company.

Recency weighting, however, isn’t at all unique to the Stuff poll of polls. For example, the pundit.co.nz poll of polls downweights older polls, but doesn’t drop the weight to zero once another poll comes out. Peter Ellis’s two summaries both downweight older polls in a more complicated and less arbitrary way; the same was true of Peter Green’s poll aggregation when he was doing it.  Curia’s average downweights even more aggressively than Stuff’s, but does not otherwise discard older polls by the same company. RadioNZ averages the only the four most recent available results (regardless of company) — they don’t do any other weighting for recency, but that’s plenty.

However, another thing recent elections have shown us is that uncertainty estimates are important: that’s what Nate Silver and almost no-one else got right in the US. The big limitation of simple, transparent poll of poll aggregators is that they say nothing useful about uncertainty.

March 29, 2017

Technological progress in NZ polling

From a long story at stoppress.co.nz

For the first time ever, Newshub and Reid Research will conduct 25 percent of its polling via the internet. The remaining 75 percent of polling will continue to be collected via landline phone calls, with its sampling size of 1000 respondents and its margin of error of 3.1 percent remaining unchanged. The addition of internet polling—aided by Trace Research and its director Andrew Zhu—will aim to enhance access to 18-35-year-olds, as well as better reflect the declining use of landlines in New Zealand.

This is probably a good thing, not just because it’s getting harder to sample people. Relying on landlines leads people who don’t understand polling to assume that, say, the Greens will do much better in the election than in the polls because their voters are younger. And they don’t.

The downside of polling over the internet is it’s much harder to tell from outside if someone is doing a reasonable job of it. From the position of a Newshub viewer, it may be hard even to distinguish bogus online clicky polls from serious internet-based opinion research. So it’s important that Trace Research gets this right, and that Newshub is careful about describing different sorts of internet surveys.

As Patrick Gower says in the story

“The interpretation of data by the media is crucial. You can have this methodology that we’re using and have it be bang on and perfect, but I could be too loose with the way I analyse and present that data, and all that hard work can be undone by that. So in the end, it comes down to me and the other people who present it.”

It does. And it’s encouraging to see that stated explicitly.

November 13, 2016

What polls aren’t good for

From Gallup, how Americans feel about the election

gallup

We can believe the broad messages that many people were surprised; that Trump supporters have positive feelings; that Clinton supporters have negative feelings; that there’s more anger and fear expressed that when Obama first was elected (though not than when he was re-elected). The surprising details are less reliable.

I’ve seen people making a lot of the 3% apparent “buyer’s remorse” among Trump voters, with one tweet I saw saying those votes would have been enough to swing the election. First of all, Clinton already has more votes that Trump, just distributed suboptimally, so even if these were Trump voters who had changed their minds it might not have made any difference to the result.  More importantly, though, Gallup has no way of knowing who the respondents voted for, or even if they voted at all.  The table is just based on what they said over the phone.

It could be that 3% of Trump voters regret it. It could also be that some Clinton voters or some non-voters claimed to have voted for Trump.  As we’ve seen in past examples even of high-quality social surveys, it’s very hard to estimate the size of a very small subpopulation from straightforward survey data.