Posts from October 2015 (50)

October 23, 2015

A little search goes a long way

The Herald has a story about cheese addiction, meant literally.

To understand why this is probably unreliable, try Wikipedia on the following terms or phrases from the story

Next, consider why Vegetarian Times is the primary source for a story purportedly about biochemistry.

October 22, 2015

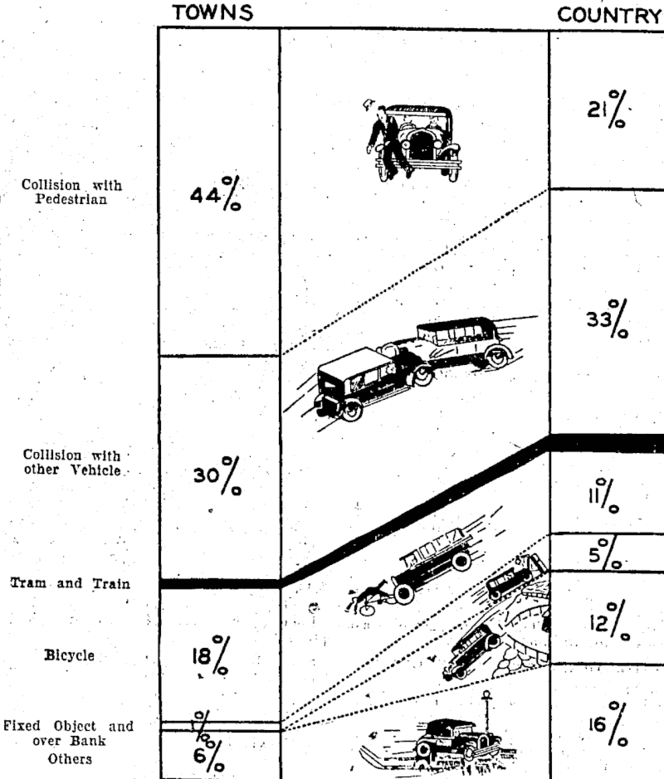
Early NZ data visualisation

From the National Library of New Zealand, via Jolisa Gracewood

natlib.govt

Types of motor-vehicle accidents in rural areas vary considerably from those ocourrlng In urban areas, as shown in tho above chart. Tho percentages are based on figures of the Transport Department in respect of accidents causing’ fatalltles during the twelve months, April I, 1932, to March 31, 1933.

The text goes on to say “The black section representing collisions with tram and train forms only I per cent, of the whole, through this type of accident appeals to the popular Imagination’ from its spectacular nature.”  Some things don’t change.

Second-hand bogus poll

Headline1 in 3 women watch porn – survey

Opening sentence: One in three young women regularly view porn, with many watching it on their smartphone, it has emerged.

It turns out this is “Some 31 per cent of participants in the survey by magazine Marie Claire.” If you Google, you can find the Marie Claire invitation to take the survey, with a link. There are also Facebook and YouTube versions of the invitation. It’s a self-selected internet survey; a bogus poll.

Considered in the context of its original purpose, this survey isn’t so bad. It’s part of a major project(possibly NSFW) by the magazine, and its contributing editor Amanda de Cadenet, to discuss women’s use of pornography.  The survey provided a way for them to involve readers, and a context for telling readers, however they responded, “there are lots of other women like you”.  From that point of view the quantitative unreliability and poorly-defined target population isn’t such a problem, though it would presumably be better to have the right numbers.

Disconnected from the magazine and presented as data-based news, the survey results have very little going for them.

The wine when it is red

Q: Are you going to have a glass of wine tonight?

A: You mean as a celebration?.

Q: No, because a glass of red wine has the same benefits as a gym session. The Herald story?

A: Yeah, nah.

Q: What part of “Red wine equal to a gym workout – study” don’t you understand?

A: How they got that from the research.

Q: Was this just correlations again?

A: No, it was a real experimental study.

Q: So I’m guessing you’re going to say “in mice”?

A: Effectively. It was in rats.

Q: They gave some rats red wine and made others do gym workouts?

A: No, there wasn’t any red wine.

Q: But the story… ah, I see. “A compound found in red wine”. They gave the rats this compound directly?

A: That’s right

Q: And the gym workouts?

A: Basically, yes. The rats did treadmill runs, though they don’t report that they had headphones on at the time.

Q: So the resveratrol group ended up fitter than the exercise group?

A: No, both groups got the workouts. The resveratrol plus exercise group ended up fitter than the group just getting exercise.

Q: So, really, it’s about a glass of red wine plus a gym workout, not instead of a gym workout? If it was people, not rats?

A: Well, not “a glass”.

Q: How many glasses?

A: The rats got 146mg resveratrol per kg of weight per day. One standard conversion rate is to divide by 7 to get mg/kg in humans: about 20. So for a 60kg person, that’s about 1200mg/day of resveratrol.

Q: How much is in a glass of wine?

A: It depends on the size, but at 5 glasses per bottle, maybe 0.3 mg

Q: So we might need bigger glasses, then.

A: At least you’ll get plenty of exercise lifting them.
October 21, 2015

Rugby World Cup Predictions for the Semi-finals

Team Ratings for the Semi-finals

The basic method is described on my Department home page.

Here are the team ratings prior to this week’s games, along with the ratings at the start of the Rugby World Cup.

Current Rating Rating at RWC Start Difference
New Zealand 28.42 29.01 -0.60
South Africa 22.84 22.73 0.10
Australia 20.85 20.36 0.50
England 16.43 18.51 -2.10
Ireland 15.97 17.48 -1.50
Wales 13.85 13.93 -0.10
Argentina 11.27 7.38 3.90
France 8.96 11.70 -2.70
Scotland 5.94 4.84 1.10
Fiji -2.19 -4.23 2.00
Samoa -4.15 -2.28 -1.90
Italy -6.37 -5.86 -0.50
Tonga -8.84 -6.31 -2.50
Japan -9.10 -11.18 2.10
USA -17.13 -15.97 -1.20
Georgia -17.74 -17.48 -0.30
Canada -17.89 -18.06 0.20
Romania -19.44 -21.20 1.80
Uruguay -31.67 -31.04 -0.60
Namibia -33.29 -35.62 2.30


Performance So Far

So far there have been 44 matches played, 37 of which were correctly predicted, a success rate of 84.1%.
Here are the predictions for last week’s games.

Game Date Score Prediction Correct
1 South Africa vs. Wales Oct 17 23 – 19 10.10 TRUE
2 New Zealand vs. France Oct 17 62 – 13 16.60 TRUE
3 Ireland vs. Argentina Oct 18 20 – 43 7.50 FALSE
4 Australia vs. Scotland Oct 18 35 – 34 16.50 TRUE


Predictions for the Semi-finals

Here are the predictions for the Semi-finals. The prediction is my estimated expected points difference with a positive margin being a win to the first-named team, and a negative margin a win to the second-named team.

Game Date Winner Prediction
1 South Africa vs. New Zealand Oct 24 New Zealand -5.60
2 Argentina vs. Australia Oct 25 Australia -9.60


ITM Cup Predictions for the ITM Cup Finals

Team Ratings for the ITM Cup Finals

The basic method is described on my Department home page.

Here are the team ratings prior to this week’s games, along with the ratings at the start of the season.

Current Rating Rating at Season Start Difference
Canterbury 13.66 10.90 2.80
Auckland 11.17 5.14 6.00
Tasman 9.23 12.86 -3.60
Taranaki 8.54 7.70 0.80
Wellington 4.00 -4.62 8.60
Counties Manukau 2.72 7.86 -5.10
Hawke’s Bay 1.77 -0.57 2.30
Otago 0.38 -4.84 5.20
Waikato -4.56 -6.96 2.40
Bay of Plenty -6.01 -9.77 3.80
Manawatu -6.69 -1.52 -5.20
North Harbour -8.60 -10.54 1.90
Southland -10.02 -6.01 -4.00
Northland -19.56 -3.64 -15.90


Performance So Far

So far there have been 74 matches played, 53 of which were correctly predicted, a success rate of 71.6%.
Here are the predictions for last week’s games.

Game Date Score Prediction Correct
1 Auckland vs. Tasman Oct 16 44 – 24 2.90 TRUE
2 Hawke’s Bay vs. Bay of Plenty Oct 17 33 – 26 12.80 TRUE
3 Canterbury vs. Taranaki Oct 17 46 – 20 5.40 TRUE
4 Wellington vs. Otago Oct 17 34 – 14 4.90 TRUE


Predictions for the ITM Cup Finals

Here are the predictions for the ITM Cup Finals. The prediction is my estimated expected points difference with a positive margin being a win to the home team, and a negative margin a win to the away team.

Game Date Winner Prediction
1 Hawke’s Bay vs. Wellington Oct 23 Hawke’s Bay 1.80
2 Canterbury vs. Auckland Oct 24 Canterbury 6.50


Currie Cup Predictions for the Currie Cup Final

Team Ratings for the Currie Cup Final

The basic method is described on my Department home page.

Here are the team ratings prior to this week’s games, along with the ratings at the start of the season.

Current Rating Rating at Season Start Difference
Lions 5.99 3.04 2.90
Western Province 5.35 4.93 0.40
Blue Bulls 1.71 0.17 1.50
Sharks 1.51 3.43 -1.90
Cheetahs -2.30 -1.75 -0.60
Pumas -6.66 -6.47 -0.20
Griquas -9.36 -7.81 -1.60
Kings -10.14 -9.44 -0.70


Performance So Far

So far there have been 42 matches played, 30 of which were correctly predicted, a success rate of 71.4%.
Here are the predictions for last week’s games.

Game Date Score Prediction Correct
1 Blue Bulls vs. Western Province Oct 16 18 – 23 0.40 FALSE
2 Lions vs. Cheetahs Oct 17 43 – 33 12.00 TRUE


Predictions for the Currie Cup Final

Here are the predictions for the Currie Cup Final. The prediction is my estimated expected points difference with a positive margin being a win to the home team, and a negative margin a win to the away team.

Game Date Winner Prediction
1 Lions vs. Western Province Oct 24 Lions 4.10


October 20, 2015

World Statistics Day

[this post by Julie Middleton]

WSD_Logo_Final_Languages_Outline

Today is World Statistics Day, and statisticians all over the world will be showcasing the value of their work under the theme ‘Better data, better lives’.
To mark the day, Statistics New Zealand is putting out three useful resources:[

1: An animated infographic that expresses the value of statistics to the economy and people as they go about their day-to-day lives;

2: A video that summarises in two minutes changes in New Zealand’s population over the last 150 years;

3: A video that summarises the highs and lows of 30 years of labour market statistics.

World Statistics Day was proclaimed by the United Nations General Assembly in 2010 to recognise the importance of statistics in shaping our societies. National and regional statistical days already existed in more than 100 countries, but the General Assembly’s adoption of this international day as 20 October brought extra momentum. That first World Statistics Day in October 2010 was marked in more than 130 countries and areas.

According to UNStats, this year marks an important cornerstone for official statistics, with the conclusion of the Millennium Development Goals (see how countries have fared here), the post-2015 development agenda, the data revolution (see what the Data Revolution Group set up by UN Secretary-General Ban Ki-Moon has to say here), the preparations for the 2020 World Population and Housing Census Programme and the likes.
One cute initiative of UNStats is to translate the English logo for World Statistics Day into many of the languages of the world. We couldn’t miss the opportunity to have UNStats do one in the first language of this country, te reo Māori. Te tino kē hoki o te moko nā! (Nice logo!)

WorldStatsDay_Logo_Maori-01
You can download logos in English, Māori and dozens of other languages from the UNStats site here.

One important initiative of the UN for this year’s commemoration is the launch, at its New York headquarters, of the report The World’s Women 2015: Trends and Statistics. The report is produced every five years under the Beijing Platform for Action, which was adopted at the Fourth World Conference on Women in 1995.

The eight chapters of the report cover several critical areas of policy concerns identified in that landmark 1995 conference: population and families; health; education; work; power and decision-making; violence against women; environment; and poverty. It takes a life-cycle approach in revealing the experiences of women and men during different periods of life.

October 19, 2015

Briefly

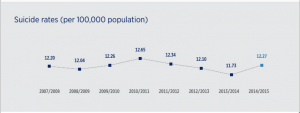
  • The Guardian says‘We have to start talking about it’: New Zealand suicide rates hit record high.” The first bit is true. The second, as I explained a couple of weeks ago, isn’t. The rate isn’t at a record high (the count is), and more generally the tragedy (or scandal) is that the rate has been basically this high for a long time. This graph is on the front page of the report from the Chief Coroner
    suicide
  • No, I don’t know why moles on your  right arm are particularly relevant to melanoma.  I don’t know because the British Journal of Dermatology told the media to print the story before they released the scientific paper. Yes, there’s a lot of this around.
  • I am pretty sure, though, that customising a UK story about melanoma with “In New Zealand, new skin cancers total about 67,000 per year” isn’t helpful. That’s all skin cancers. For melanoma the figure is about 2500 (from the Ministry of Health) or about 4000 (from Melanoma NZ). I think the difference between the two figures may be that the Ministry of Health don’t count melanoma in situ. Either way, not 67,000.
  • Experimental evidence that decorating your barcharts with round bits or pointy bits really makes them less readable. (via @albertocairo)
  • Nicholas Felton has been collecting data about himself and making art in the form of Personal Annual Reports for ten years. His latest and last is out now.
  • New factsheets from the (UK) Patient Information Forum, on communicating risk (via David Spiegelhalter)
  • People are more afraid of shark attacks than car accidents despite the fact that car accidents are much more likely. SMBC has a solution to this problem. It involves marine biology. (via @scicomguy)

Flag referendum stats

UMR have done a survey of preferences on the new flag candidates that can be used to predict the preferential-voting result.  According to their data, while Red Peak has improved a long way from basically no support in August, it has only improved enough to be a clear third to the two Lockwood ferns, which are basically tied for the lead both on first preferences and on full STV count.  On the other hand, none of the new candidates is currently anywhere near beating the current version.

The error in a poll like this is probably larger than in an election poll, because there’s no relevant past data to work with. Also, for the second round of the referendum, it’s possible that cutting the proposals down to a single alternative will affect opinion. And, who knows, maybe Red Peak will keep gaining popularity.