Posts from September 2017 (36)

September 30, 2017

Simple and ineffective

Q: Did you see there’s a new test to predict dementia?

A: Another one?

Q: Yes, the Herald says it  “would allow drugs and lifestyle changes, such as a healthy diet and more exercise, to be more effective before the devastating condition takes hold.

A: That would make more sense if there were drugs and lifestyle changes that actually worked to stop the disease process.

Q: At least it’s a simple one and accurate test. It’s just based on your sense of smell.

A: <dubious noises>

Q: But  “almost all the participants, aged 57 to 85, who were unable to name a single scent had been diagnosed with dementia. And nearly 80 per cent of those who provided just one or two correct answers also had it,

A: That’ s not what the research says

Q: It’s what the story says.

A: Yes. Yes, it is.

Q: Ok, what does the research say? It’s behind a paywall
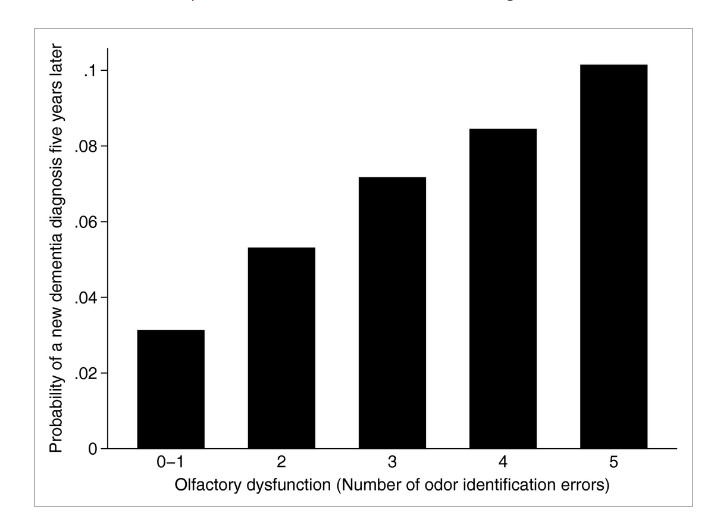
A: Here’s a graph
scents

Q: That matches the story, doesn’t it?

A: Check the axis labels.

Q: Oh. 8% and 10%? But couldn’t the labels just be wrong?

A: Rather than the Daily Mail? It’s possible, but the research paper also says “9% positive predictive value”, meaning that only 9% of those who are predicted to get dementia actually do, and that matches the graph.

Q: Um

A: And there’s a commentary in the same issue of the journal, headlined  Screening Is Not Benign and saying “No test with such a low [positive predictive value] would be taken seriously as a way to identify any disease in a population”

Q: But it’s still a big difference, isn’t it.

A: Yes, and it’s scientifically interesting that the nerves or brain cells related to smell seem to be damaged relatively early in the disease, but it’s not a predictive test.


[Update: the source for the error seems to be the University of Chicago press release.]

[Update: It’s on Stuff, too]

September 27, 2017

Stat Soc of Australia on Marriage Survey

The Statistical Society of Australia has put out a press release on the Australian Marriage Law Postal Survey.  Their concern, in summary, is that if this is supposed to be a survey rather than a vote, the Government has required a pretty crap survey and this isn’t good.

The SSA is concerned that, as a result, the correct interpretation of the Survey results will be missed or ignored by some community groups, who may interpret the resulting proportion for or against same-sex marriage as representative of the opinion of all Australians. This may subsequently, and erroneously, damage the reputation of the ABS and the statistical community as a whole, when it is realised that the Survey results can not be understood in these terms.

and

The SSA is not aware of any official statistics based purely on unadjusted respondent data alone. The ABS routinely adjusts population numbers derived from the census to allow for under and over enumeration issues via its post-enumeration survey. However, under the Government direction, there is there no scope to adjust for demographic biases or collect any information that might enable the ABS to even indicate what these biases might be.

If the aim was to understand the views of all Australians, an opinion survey would be more appropriate. High quality professionally-designed opinion surveys are routinely carried out by market research companies, the ABS, and other institutions. Surveys can be an efficient and powerful tool for canvassing a population, making use of statistical techniques to ensure that the results are proportioned according to the demographics of the population. With a proper survey design and analysis, public opinion can be reliably estimated to a specified accuracy. They can also be implemented at a fraction of the cost of the present Postal Survey. The ABS has a world-class reputation and expertise in this area.

(They’re not actually saying this is the most important deficiency of the process, just that it’s the most statistical one)

Briefly

  • “This 30-point shift could be because attitudes changed rapidly. Villasenor’s study was immediately after Charlottesville, for example, and students might be more primed to think about Nazi’s marching on their campus…It could also be because of differences in survey methods. Surveying college students is really hard.
  • From the Ottawa CitizenIn six high-profile cases documented by the Citizen, searching the name of a young offender or victim online pointed to media coverage of their court cases, even though their names do not appear anywhere in the news articles themselves.
September 26, 2017

Currie Cup Predictions for Round 12

Team Ratings for Round 12

The basic method is described on my Department home page.

Here are the team ratings prior to this week’s games, along with the ratings at the start of the season.

Current Rating Rating at Season Start Difference
Sharks 5.31 2.15 3.20
Western Province 3.84 3.30 0.50
Lions 3.02 7.41 -4.40
Cheetahs 2.73 4.33 -1.60
Blue Bulls 0.16 2.32 -2.20
Pumas -6.51 -10.63 4.10
Griquas -11.29 -11.62 0.30


Performance So Far

So far there have been 33 matches played, 23 of which were correctly predicted, a success rate of 69.7%.
Here are the predictions for last week’s games.

Game Date Score Prediction Correct
1 Sharks vs. Blue Bulls Sep 23 18 – 5 9.00 TRUE
2 Western Province vs. Griquas Sep 23 55 – 27 18.90 TRUE
3 Cheetahs vs. Pumas Sep 23 33 – 32 14.70 TRUE


Predictions for Round 12

Here are the predictions for Round 12. The prediction is my estimated expected points difference with a positive margin being a win to the home team, and a negative margin a win to the away team.

The Cheetahs have been playing in the Pro 14 competition and fielding a second or third team in the Currie Cup. With little experience so far it is difficult to estimate the difference in expected points this might make. After 3 such games a quick estimate is that they might score 23 points less than if they were fielding their best team, but losses so far will have dropped their rating a couple of points already. I would guess that a difference of 21 points might be appropriate, so instead of the points difference being -9.50 below, it might be 11.5 and a win to Griquas.

Game Date Winner Prediction
1 Sharks vs. Lions Sep 29 Sharks 6.80
2 Griquas vs. Cheetahs Sep 30 Cheetahs -9.50
3 Blue Bulls vs. Western Province Oct 01 Blue Bulls 0.80


Mitre 10 Cup Predictions for Round 7

Team Ratings for Round 7

The basic method is described on my Department home page.

Here are the team ratings prior to this week’s games, along with the ratings at the start of the season.

Current Rating Rating at Season Start Difference
Canterbury 19.36 14.78 4.60
Wellington 10.36 -1.62 12.00
Taranaki 7.63 7.04 0.60
North Harbour 5.30 -1.27 6.60
Tasman 4.84 9.54 -4.70
Otago 3.81 -0.34 4.20
Counties Manukau -0.79 5.70 -6.50
Manawatu -1.32 -3.59 2.30
Bay of Plenty -1.63 -3.98 2.30
Auckland -2.13 6.11 -8.20
Waikato -4.08 -0.26 -3.80
Northland -5.07 -12.37 7.30
Hawke’s Bay -14.93 -5.85 -9.10
Southland -23.97 -16.50 -7.50


Performance So Far

So far there have been 46 matches played, 31 of which were correctly predicted, a success rate of 67.4%.
Here are the predictions for last week’s games.

Game Date Score Prediction Correct
1 Bay of Plenty vs. Southland Sep 20 57 – 0 20.00 TRUE
2 Otago vs. Auckland Sep 21 34 – 26 10.40 TRUE
3 Manawatu vs. Northland Sep 22 39 – 25 6.40 TRUE
4 North Harbour vs. Canterbury Sep 23 28 – 41 -9.40 TRUE
5 Waikato vs. Wellington Sep 23 10 – 34 -7.50 TRUE
6 Hawke’s Bay vs. Taranaki Sep 23 17 – 48 -15.80 TRUE
7 Bay of Plenty vs. Counties Manukau Sep 24 31 – 31 0.50 FALSE
8 Tasman vs. Southland Sep 24 50 – 17 29.40 TRUE


Predictions for Round 7

Here are the predictions for Round 7. The prediction is my estimated expected points difference with a positive margin being a win to the home team, and a negative margin a win to the away team.

Game Date Winner Prediction
1 Northland vs. Otago Sep 27 Otago -4.90
2 Taranaki vs. Tasman Sep 28 Taranaki 6.80
3 North Harbour vs. Hawke’s Bay Sep 29 North Harbour 24.20
4 Southland vs. Manawatu Sep 30 Manawatu -18.60
5 Auckland vs. Bay of Plenty Sep 30 Auckland 3.50
6 Canterbury vs. Waikato Sep 30 Canterbury 27.40
7 Wellington vs. Otago Oct 01 Wellington 10.50
8 Counties Manukau vs. Northland Oct 01 Counties Manukau 8.30


NRL Predictions for the Grand Final

Team Ratings for the Grand Final

The basic method is described on my Department home page.

Here are the team ratings prior to this week’s games, along with the ratings at the start of the season.

Current Rating Rating at Season Start Difference
Storm 15.88 8.49 7.40
Broncos 5.08 4.36 0.70
Cowboys 4.71 6.90 -2.20
Raiders 4.07 9.94 -5.90
Panthers 2.80 6.08 -3.30
Sharks 2.55 5.84 -3.30
Eels 1.60 -0.81 2.40
Roosters 0.21 -1.17 1.40
Dragons -0.94 -7.74 6.80
Sea Eagles -1.11 -2.98 1.90
Bulldogs -3.55 -1.34 -2.20
Wests Tigers -3.72 -3.89 0.20
Rabbitohs -3.84 -1.82 -2.00
Warriors -7.23 -6.02 -1.20
Titans -9.03 -0.98 -8.10
Knights -9.54 -16.94 7.40


Performance So Far

So far there have been 200 matches played, 120 of which were correctly predicted, a success rate of 60%.
Here are the predictions for last week’s games.

Game Date Score Prediction Correct
1 Storm vs. Broncos Sep 22 30 – 0 11.40 TRUE
2 Roosters vs. Cowboys Sep 23 16 – 29 1.30 FALSE


Predictions for the Grand Final

Here are the predictions for the Grand Final. The prediction is my estimated expected points difference with a positive margin being a win to the home team, and a negative margin a win to the away team.

Game Date Winner Prediction
1 Storm vs. Cowboys Oct 01 Storm 11.20


September 25, 2017

Stat of the Week Competition: September 23 – 29 2017

Each week, we would like to invite readers of Stats Chat to submit nominations for our Stat of the Week competition and be in with the chance to win an iTunes voucher.

Here’s how it works:

  • Anyone may add a comment on this post to nominate their Stat of the Week candidate before midday Friday September 29 2017.
  • Statistics can be bad, exemplary or fascinating.
  • The statistic must be in the NZ media during the period of September 23 – 29 2017 inclusive.
  • Quote the statistic, when and where it was published and tell us why it should be our Stat of the Week.

Next Monday at midday we’ll announce the winner of this week’s Stat of the Week competition, and start a new one.

(more…)

Stat of the Week Competition Discussion: September 23 – 29 2017

If you’d like to comment on or debate any of this week’s Stat of the Week nominations, please do so below!

September 24, 2017

The polls

So, how did the polls do this time? First, the main result was predicted correctly: either side needs a coalition with NZ First.

In more detail, here are the results from Peter Ellis’s forecasts from the page that lets you pick coalitions.

Each graph has three arrows. The red arrow shows the 2014 results. The blue/black arrow pointing down shows the current provisional count and the implied number of seats, and the horizontal arrow points to Graeme Edgeler’s estimate of what the special votes will do (not because he claims any higher knowledge, but because his estimates are on a web page and explain how he did it).

First, for National+ACT+UnitedFuture

national

Second, for Labour+Greens

labgrn

The result is well within  the uncertainty range of the predictions for Labour+Greens, and not bad for  National. This isn’t just because NZ politics is easy to predict: the previous election’s results are much further away. In particular, Labour really did gain a lot more votes than could reasonably have been expected a few months ago.


Update: Yes, there’s a lot of uncertainty. And, yes, that does  mean quoting opinion poll results to the nearest 0.1% is silly.

September 20, 2017

Democracy is coming

Unless someone says something really annoyingly wrong about polling in the next few days, I’m going to stop commenting until Saturday night.

Some final thoughts:

  • The election looks closer than NZ opinion polling is able to discriminate. Anyone who thinks they know what the result will be is wrong.
  • The most reliable prediction based on polling data is that the next government will at least need confidence and supply from NZ First. Even that isn’t certain.
  • It’s only because of opinion polling that we know the election is close. It would be really surprising if Labour didn’t do a lot better than the 25% they managed in the 2014 election — but we wouldn’t know that without the opinion polls.