Posts from September 2017 (36)

September 20, 2017

Takes two to tango

Right from the start of StatsChat we’ve looked at stories about how men or women have more sexual partners. There’s another one in the Herald as a Stat of the Week nomination.

To start off, there’s the basic adding-up constraint: among exclusively heterosexual people, or restricted to opposite-sex partners, the two averages are necessarily identical over the whole population.

This survey (the original version of the story is here) doesn’t say that it just asked about opposite-sex partners, so the difference could be true.  On average, gay men have more sexual partners and lesbians have fewer sexual partners, so you’d expect a slightly higher average for all men than for all women.  Using binary classifications for trans and non-binary people will also stop the numbers matching exactly.

But there are bigger problems. First, 30% of women and 40% of men admit this is something they lie about. And while the rest claim they’ve never lied about it, well, they would, wouldn’t they?

And the survey doesn’t look all that representative.  The “Methodology” heading is almost entirely unhelpful — it’s supposed to say how you found the people, not just

We surveyed 2,180 respondents on questions relating to sexual history. 1,263 respondents identified as male with 917 respondents identifying as female. Of these respondents, 1,058 were from the United States and another 1,122 were located within Europe. Countries represented by fewer than 10 respondents and states represented by fewer than five respondents were omitted from results.

However, the sample is clearly not representative by gender or location, and the fact that they dropped some states and countries afterwards suggests they weren’t doing anything to get a representative sample.

The Herald has a bogus clicky poll on the subject. Here’s what it looks like on my desktop

sex

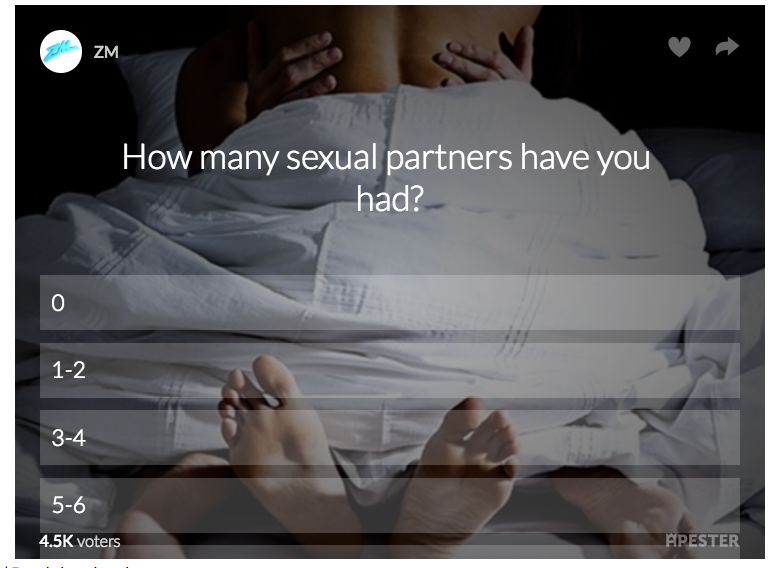
On my phone it gets a couple more options visible, but not all of them. It’s probably less reliable than the survey in the story, but not by a whole lot.

This sort of story can be useful in making people more willing to talk about their sexual histories, but the actual numbers don’t mean a lot.

September 19, 2017

Briefly

  • During the Cold War, there were a few occasions where a nuclear war could easily have started if one person hadn’t got in the way. One of those people was Stanislav Petrov. He died this week.
  • I saw a pharmacy in Ponsonby advertising “Ultrasound bone density screening for all ages”. There’s no way screening for osteoporosis makes sense ‘for all ages’, even if it was free (which it isn’t).
  • As I’ve mentioned a few times, the UK has an independent Statistics Authority whose chair is supposed to monitor and rebuke misuses of official statistics. The chair, Sir David Norgrove, criticised Boris Johnson over the £350m “savings” from Brexit he has kept repeating. We don’t have anything similar, sadly.
  • If you’re interested in the history of data journalism, you could do worse than reading Alberto Cairo’s PhD thesis. Dr Cairo is a former data journalist, current professor of visual journalism at the University of Miami, and one of next year’s Ihaka Lecture speakers here in Auckland.
  • Janelle Shane has a blog with examples of neural networks generalising from a wide range of inputs (recipes, hamster names, craft beers). Her current post is on D&D spell names, and shows the importance of a large input set for these networks: would you prefer your character to cast “Plonting Cloud” or “Wall of Storm”?
  • Kieran Healy, of Duke University, has an online book Data Visualization for Social Science. Yes, if you think you recognise the name, it’s him.
  • The American Statistical Association and the New York Times are partnering in a new monthly feature, “What’s Going On in This Graph?”

Denominators and BIGNUMs

billennial

It’s pretty obvious that Bon Appétit has just confused averages and totals here.

So, what is the average? There were about 75 million millennials in the US in 2016 (we can probably assume  Bon Appétit doesn’t care about other countries), so we’re looking at $1280/year, or about $25/week. Which actually seems pretty low as an average.  The US as a whole spent $1.46 trillion on food and beverages in 2014, which is about $4500/person/year or about $87/week.

As with so much generation-mongering, asking about the facts is missing the intended purpose of the story, which is to recycle some stereotypes about lazy/wasteful youth.

The story links to another, about a new book “Generation Yum”

Turow characterized the quintessential Millennial experience this way: “You got into a top tier high school, you hustled through college—you’ve done everything society told you—and you’re not rewarded. 

When “get into a top-tier high school” is a quintessential generational experience it’s clear we’re not even trying to go beyond unrepresentative stereotypes.  In which case, hold the numbers.

NRL Predictions for the Preliminary Finals

Team Ratings for the Preliminary Finals

The basic method is described on my Department home page.

Here are the team ratings prior to this week’s games, along with the ratings at the start of the season.

Current Rating Rating at Season Start Difference
Storm 14.43 8.49 5.90
Broncos 6.53 4.36 2.20
Raiders 4.07 9.94 -5.90
Cowboys 3.58 6.90 -3.30
Panthers 2.80 6.08 -3.30
Sharks 2.55 5.84 -3.30
Eels 1.60 -0.81 2.40
Roosters 1.34 -1.17 2.50
Dragons -0.94 -7.74 6.80
Sea Eagles -1.11 -2.98 1.90
Bulldogs -3.55 -1.34 -2.20
Wests Tigers -3.72 -3.89 0.20
Rabbitohs -3.84 -1.82 -2.00
Warriors -7.23 -6.02 -1.20
Titans -9.03 -0.98 -8.10
Knights -9.54 -16.94 7.40


Performance So Far

So far there have been 198 matches played, 119 of which were correctly predicted, a success rate of 60.1%.
Here are the predictions for last week’s games.

Game Date Score Prediction Correct
1 Broncos vs. Panthers Sep 15 13 – 6 7.30 TRUE
2 Eels vs. Cowboys Sep 16 16 – 24 3.30 FALSE


Predictions for the Preliminary Finals

Here are the predictions for the Preliminary Finals. The prediction is my estimated expected points difference with a positive margin being a win to the home team, and a negative margin a win to the away team.

Game Date Winner Prediction
1 Storm vs. Broncos Sep 22 Storm 11.40
2 Roosters vs. Cowboys Sep 23 Roosters 1.30


Mitre 10 Cup Predictions for Round 6

Team Ratings for Round 6

The basic method is described on my Department home page.

Here are the team ratings prior to this week’s games, along with the ratings at the start of the season.

Current Rating Rating at Season Start Difference
Canterbury 19.04 14.78 4.30
Wellington 8.87 -1.62 10.50
Taranaki 6.27 7.04 -0.80
North Harbour 5.62 -1.27 6.90
Tasman 4.82 9.54 -4.70
Otago 4.03 -0.34 4.40
Counties Manukau -1.13 5.70 -6.80
Manawatu -2.01 -3.59 1.60
Auckland -2.34 6.11 -8.40
Waikato -2.59 -0.26 -2.30
Northland -4.38 -12.37 8.00
Bay of Plenty -4.61 -3.98 -0.60
Hawke’s Bay -13.56 -5.85 -7.70
Southland -20.62 -16.50 -4.10

Performance So Far

So far there have been 38 matches played, 24 of which were correctly predicted, a success rate of 63.2%.
Here are the predictions for last week’s games.

Game Date Score Prediction Correct
1 Canterbury vs. Counties Manukau Sep 13 78 – 5 20.80 TRUE
2 Northland vs. North Harbour Sep 14 22 – 31 -5.40 TRUE
3 Southland vs. Auckland Sep 15 17 – 27 -15.20 TRUE
4 Taranaki vs. Bay of Plenty Sep 15 29 – 7 13.30 TRUE
5 Waikato vs. Manawatu Sep 16 10 – 23 7.00 FALSE
6 Otago vs. Tasman Sep 16 27 – 29 4.40 FALSE
7 Counties Manukau vs. Hawke’s Bay Sep 17 33 – 14 20.60 TRUE
8 Wellington vs. Canterbury Sep 17 60 – 14 -12.90 FALSE


Predictions for Round 6

Here are the predictions for Round 6. The prediction is my estimated expected points difference with a positive margin being a win to the home team, and a negative margin a win to the away team.

Game Date Winner Prediction
1 Bay of Plenty vs. Southland Sep 20 Bay of Plenty 20.00
2 Otago vs. Auckland Sep 21 Otago 10.40
3 Manawatu vs. Northland Sep 22 Manawatu 6.40
4 North Harbour vs. Canterbury Sep 23 Canterbury -9.40
5 Waikato vs. Wellington Sep 23 Wellington -7.50
6 Hawke’s Bay vs. Taranaki Sep 23 Taranaki -15.80
7 Bay of Plenty vs. Counties Manukau Sep 24 Bay of Plenty 0.50
8 Tasman vs. Southland Sep 24 Tasman 29.40


Currie Cup Predictions for Round 11

Team Ratings for Round 11

The basic method is described on my Department home page.

Here are the team ratings prior to this week’s games, along with the ratings at the start of the season.

Current Rating Rating at Season Start Difference
Sharks 4.99 2.15 2.80
Western Province 3.46 3.30 0.20
Cheetahs 3.23 4.33 -1.10
Lions 3.02 7.41 -4.40
Blue Bulls 0.47 2.32 -1.90
Pumas -7.01 -10.63 3.60
Griquas -10.91 -11.62 0.70


Performance So Far

So far there have been 30 matches played, 20 of which were correctly predicted, a success rate of 66.7%.
Here are the predictions for last week’s games.

Game Date Score Prediction Correct
1 Pumas vs. Western Province Sep 15 22 – 12 -7.10 FALSE
2 Griquas vs. Sharks Sep 16 22 – 40 -10.10 TRUE
3 Lions vs. Blue Bulls Sep 16 36 – 33 7.80 TRUE


Predictions for Round 11

Here are the predictions for Round 11. The prediction is my estimated expected points difference with a positive margin being a win to the home team, and a negative margin a win to the away team.

Game Date Winner Prediction
1 Sharks vs. Blue Bulls Sep 23 Sharks 9.00
2 Western Province vs. Griquas Sep 23 Western Province 18.90
3 Cheetahs vs. Pumas Sep 23 Cheetahs 14.70


September 18, 2017

Another Alzheimer’s test

There’s a new Herald story with the lead

Artificial intelligence (AI) can identify Alzheimer’s disease 10 years before doctors can discover the symptoms, according to new research.

The story doesn’t link (even to the Daily Mail). Before we get to that, regular StatsChat readers will have some idea of what to expect.

Early diagnosis for Alzheimer’s is potentially useful when designing clinical trials for new treatments, and eventually will be useful for early treatment (when we get treatments that work).  But not yet.  It’s also not as much of a novelty as the story suggests. Candidate tests for early diagnosis are appearing all over the place (here’s seven of them).

Second, you’d expect that the accuracy of the test and its degree of foresight to have been exaggerated — and the story confirms this.

Following the training, the AI was then asked to process brains from 148 subjects – 52 were healthy, 48 had Alzheimer’s disease and 48 had mild cognitive impairment (MCI) but were known to have developed Alzheimer’s disease two and a half to nine years later.

That is, the early diagnosis wasn’t of people without symptoms, it was of people whose symptoms had led to a diagnosis but didn’t amount to dementia

The Herald doesn’t link, but Google finds a story at New Scientist, and they do link. The link is to the arXiv preprint server. That’s unusual: normally this sort of story is either complete vapour or is based on an article in a research journal.  This one is neither: it’s a real scientific report, but one that hasn’t yet been published — it’s probably undergoing peer review at the moment.

Anyway, the preprint is enough to look up the accuracy of the test. The sensitivity was high: nearly all Alzheimer’s cases and cases of Mild Cognitive Impairement were picked up. The specificity was terrible: more than 1/4 of people tested would receive a false positive diagnosis.

It’s possible that this test can be re-tuned into a genuinely useful clinical tool. As published, though, it isn’t even close.

But probably not

Q: Did you see icecream for breakfast may improve mental performance?

icecream

A: Pigs may fly

Q: But it’s a STUDY

A: That’s actually one of the questions left unresolved.

Q: Just follow the link. The International Business Times links to their source.

A: That link is to a Japanese news site. And it’s 404.

Q: Already? The tweet was just from this weekend.

A: The story is from November last year.

Q: But there’s a professor! Isn’t he real? Can’t you look at his publications.

A: Yes, he’s real. And he has publications. And they aren’t about icecream for breakfast.

Q: Back to the icecream. It could still be true, even if the data aren’t published, right?

A: Sure. In fact there’s a fair chance that, compared to no breakfast, icecream could improve mental performance.

Q: The comparison was to not eating anything?

A: It was compared to a glass of cold water.

Q: So, what does this tell us?

A: 2017 must be a slow news year.

Stat of the Week Competition: September 16 – 22 2017

Each week, we would like to invite readers of Stats Chat to submit nominations for our Stat of the Week competition and be in with the chance to win an iTunes voucher.

Here’s how it works:

  • Anyone may add a comment on this post to nominate their Stat of the Week candidate before midday Friday September 22 2017.
  • Statistics can be bad, exemplary or fascinating.
  • The statistic must be in the NZ media during the period of September 16 – 22 2017 inclusive.
  • Quote the statistic, when and where it was published and tell us why it should be our Stat of the Week.

Next Monday at midday we’ll announce the winner of this week’s Stat of the Week competition, and start a new one.

(more…)

Stat of the Week Competition Discussion: September 16 – 22 2017

If you’d like to comment on or debate any of this week’s Stat of the Week nominations, please do so below!