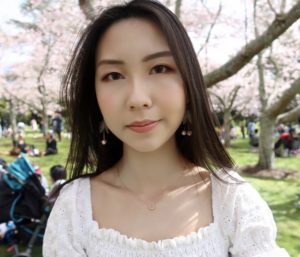
 Every summer, the Department of Statistics offers scholarships to high-achieving students so they can work with staff on real-world projects. Monica Merchant, right, is working with Professor Chris Wild on iNZight, the free data visualisation and analysis software he developed.
Monica, a BCom (Hons)/BSc student, is working on developing the predictive analytics module of the iNZight software, a toolbox that allows that allows users to build their own predictive model from a real-world dataset of their choice.
The module – whose interface is menu-driven and doesn’t require any knowledge of R, the environment in which iNZight is developed – guides the user through the model-building process, from data pre-processing and model training to tuning and validation.
Most importantly, says Monica, the module goes beyond traditional modelling methods by giving the user access to the full suite of machine learning algorithms available in R. Users can apply multiple algorithms to the data to explore differences in fit, predictive performance and generalisability.
This project is useful, says Monica, because it gives us another way to make sense of the data around us: “There is a lot of it and not all of it is created equal. We need ways to intelligently convert these large volumes of data into meaningful insights and actionable knowledge.”
She adds, “This is where machine learning comes in – the basic idea is to let the machine iteratively learn from the data to uncover underlying relationships and patterns or predict outcomes.”
Monica points out that while machine learning as a concept isn’t new – much of the theoretical groundwork behind many of its algorithms was laid in the mid-to-late 20th century – it has been only in recent years that advances in computational power have enabled us to make large-scale use of these algorithms in the real world.
Today, these algorithms are used everywhere, from bioinformatics and medical diagnosing to software engineering, financial markets, agriculture, astronomy and self-driving cars – but as Monica says, “this barely scratches the surface – check out Google Brain and DeepMind”.
Monica started her university career studying a Bachelor of Commerce in Finance, Accounting and Economics. Her Honours dissertation looked at the predictive power of option-implied risk-neutral densities, which sparked an interest in statistical computing. She added a BSc in Statistics.
Asked why statistics appeals, she says, “a degree in statistics is powerful since it offers a diverse and nearly limitless range of applications. I don’t have to limit myself to any one industry. Monica describes herself as inquisitive by nature, “so using data to solve real-world problems is always very rewarding”.
- For general information on University of Auckland summer scholarships, click here.
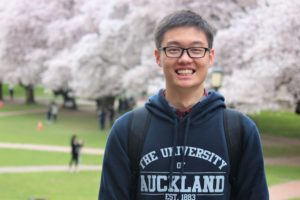 is working with Dr Ben Stevenson, an expert in statistical methods for estimating animal populations.