Do the numbers make sense?
From USA Today, via Twitter
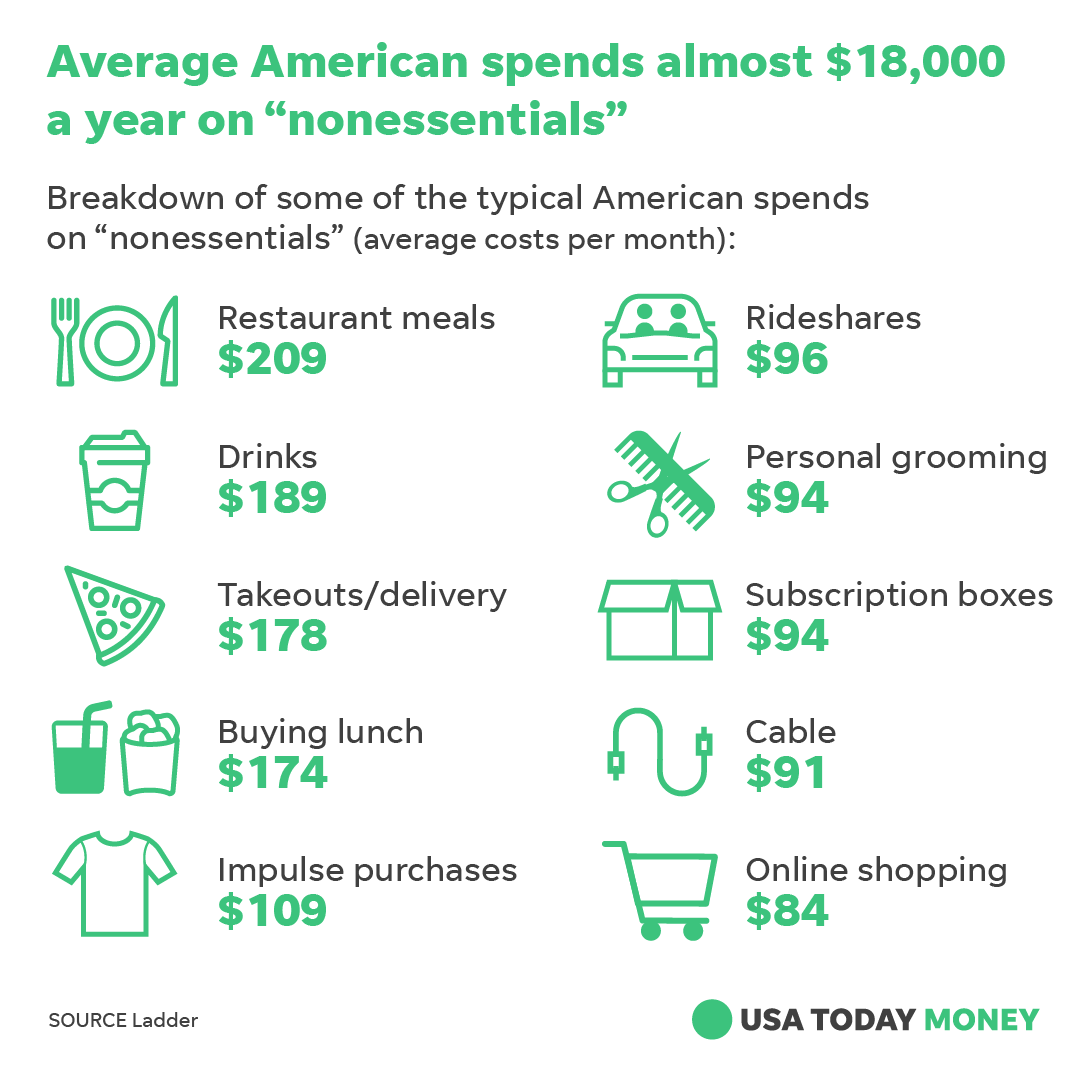
These figures don’t make a lot of sense.
Firstly, that’s a really high proportion of median income. You can easily find median household income in the US as just over $60,000. If a typical household had two members who each spent $18,000 on “nonessentials”, that’s more than half their total income, which is hard to believe. [We’re just doing obvious credibility checks here, but from more detailed data (table H-15) the median per-person household income is $34,000]
It’s still possible that the figures are true, but really are means and have nothing to do with the “typical American”. But consider the numbers for subscription boxes and rideshares. If these are means for adults in the US, we can multiply by 250 million to get the corresponding totals of just under and just over $290 billion per year. A quick Google search finds that Uber’s gross income from bookings was about $14 billion last year (which I think includes Uber Eats as well as rideshare). Uber is the largest rideshare company, and there’s no way it’s only 5% of the total market.
It’s harder to find data for e-commerce subscription boxes, but McKinsey says total revenue for the companies in that category that are on a list of the top 500 internet retailers was $2.6 billion in 2016, and whatever people say about long-tail e-commerce, I don’t believe those top companies have less than 1% of the market.
If you click through to look for the data source, there’s nothing there that gives any information. Nothing about the questions asked; nothing about how the people were selected; nothing about how representative the sample ended up being.
Chris Knox (of the NZ Herald) pointed me to a twitter thread where Kate Rabinowitz (of the Washington Post) compared the numbers to the Bureau of Labor Statistics’ Consumer Expenditure (CE) Survey. Clearly some reporters understand the issue. But it shouldn’t be possible for a life insurance company to report a dubious survey as a way to get advertising in a major newspaper. Make them buy an ad instead.
Thomas Lumley (@tslumley) is Professor of Biostatistics at the University of Auckland. His research interests include semiparametric models, survey sampling, statistical computing, foundations of statistics, and whatever methodological problems his medical collaborators come up with. He also blogs at Biased and Inefficient See all posts by Thomas Lumley »
” . . . total revenue for the companies in that category that are on a list of the top 500 internet retailers was $2.6 billion in 2016, and whatever people say about long-tail e-commerce, I don’t believe those top companies have less than 1% of the market.”
Agreed. Simple math suggests that if the top 500 companies are less than 1% of the market, even with a close approximation to a uniform distribution, that suggests a minimum of 50,000 companies offering subscription boxes (which seems very high) and (with any kind of distribution — like an actual tail) many times that. Amazon has 350,000 workers in the United States, so that suggests something rather remarkable for e-commerce employment if it is one of 500 companies that together are less than 1% of the market.
7 years ago
This consumer spending story seems to be better researched article with references to ‘2016 Bureau of Labor Statistics Consumer Expenditure Survey’.
The target group for this story seems to single millennial’s. ( between 25-34)
‘The average male millennial in our data set earns $44,670 while the average female millennial earns $40,789’
https://smartasset.com/checking-account/millennial-money-spending-habits
Its difficult to tease out non essential spending but does give details of all spending for the millennial group per year.
Food away from home F $2,300, while M is $3000
Alcohol its F $500 while M is $915.
7 years ago
I have seem similar numbers elsewhere and it looks like these are conditional on the spend being non-zero. eg If a subscription exists, this is the average spend on a subscription. So this is what an average American who makes this category of non-essential purchases spends on average on that category. As a consequence the categories cannot be summed across the population and cannot be summed across categories
7 years ago
That would make the numbers more plausible. As you note, it would make the $18,000/month completely wrong.
7 years ago