May 17, 2019
Briefly
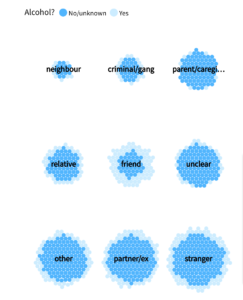
- From Stuff, an interactive visualisation of homicides in New Zealand, which also lets you do your own comparisons. For example, this one shows that alcohol is most often involved when people are killed by a friend
- From the LA Times, a visualisation mapping the settlements of the Tongva, who lived in Los Angeles before it was colonised.
- Previously the questions raised about mining in Foulden Maar haven’t been StatsChat-relevant, but this from Newsroom is. It says animal nutrition specialists are skeptical that the diatomaceous earth is actually of any benefit as an animal food, and there doesn’t appear to be any published research supporting its use. The story also says one of the selling points of the earth is that it contains fulvic acid, which I can recognise as a popular pseudoscience topic (when consumed; it’s a perfectly good soil component).
- Sometimes researchers do try to fight back when their work is exaggerated in the media: here’s an example on Twitter
- A well-sourced Twitter thread from Russell Brown, on how saliva testing to see if drivers are impaired by cannabis is nowhere near ready for use. Note that it’s not even fit for purpose if you’re trying to detect cannabis use, let alone for detecting impairment.
- Epidemic simulations on a network, letting you fiddle with various characteristics of the disease/meme/whatever

Thomas Lumley (@tslumley) is Professor of Biostatistics at the University of Auckland. His research interests include semiparametric models, survey sampling, statistical computing, foundations of statistics, and whatever methodological problems his medical collaborators come up with. He also blogs at Biased and Inefficient See all posts by Thomas Lumley »
Referring to the anecdotal reports of Canadian police and the Drager test kit and compared to ‘roadside sobriety test’
There has been a double blind, placebo controlled study done for comparing the two
‘SFST were mildly sensitive to impairment from cannabis in heavy users. Lack of sensitivity might be attributed to tolerance and time of testing. SFST were sensitive to both doses of alcohol. The Dräger Drug Test® 5000 appears to be a promising tool for detecting THC in oral fluid as far as correct THC detection is concerned.’
https://www.ncbi.nlm.nih.gov/pmc/articles/PMC3456923/
RB is not a good source for these sorts of stories, as you would expect from a drug reform campaigner he only finds what he is looking for – in this case anecdotal evidence about a saliva test. Roadside impairment tests are not better.
‘The point of collection testing devices provided mixed results. The Dräger Drug Test® 5000 generally performed quite well and only produced false negative in 6 % of the measurements during 2.5 h after smoking.’
7 years ago
The homicide alcohol graphic is different. It is also difficult to read. Why not use a spineplot sorted by the percentage with alcohol involved?
7 years ago
I agree. It may be a software limitation: they’re using https://flourish.studio/ and none of the obvious examples there has a spineplot.
[makes note to check that we’re teaching spineplots to undergraduates]
7 years ago