Another reason why we don’t know the COVID-19 mortality rate
“The” mortality rate isn’t a thing.
We know that older people are more likely to die than younger people — age is routinely and accurately recorded by hospitals, so the comparisons are relatively straightforward. There’s less evidence for other general health risk factors, but there’s definitely some, and less healthy people are more likely to die. Also, if there’s any point to our concern about running out of intensive care beds, then ICU treatment makes a different to the death rate. It’s quite likely that there are other environmental factors, such as the types of bacteria that are around to cause secondary infections.
All this is hard to be sure about, but at least we should be interested in age-specific rates, either on their own or combined into an age-standardised rate. David Spiegelhalter (statistician, risk communication expert from Cambridge) used estimates from the UK epidemic modellers(PDF) at Imperial College to draw this graph. The estimates attempt to model both the detection/testing rate and the fact that some people in the data set were still sick. There’s still uncertainty as to the absolute level, but the estimates are reasonable
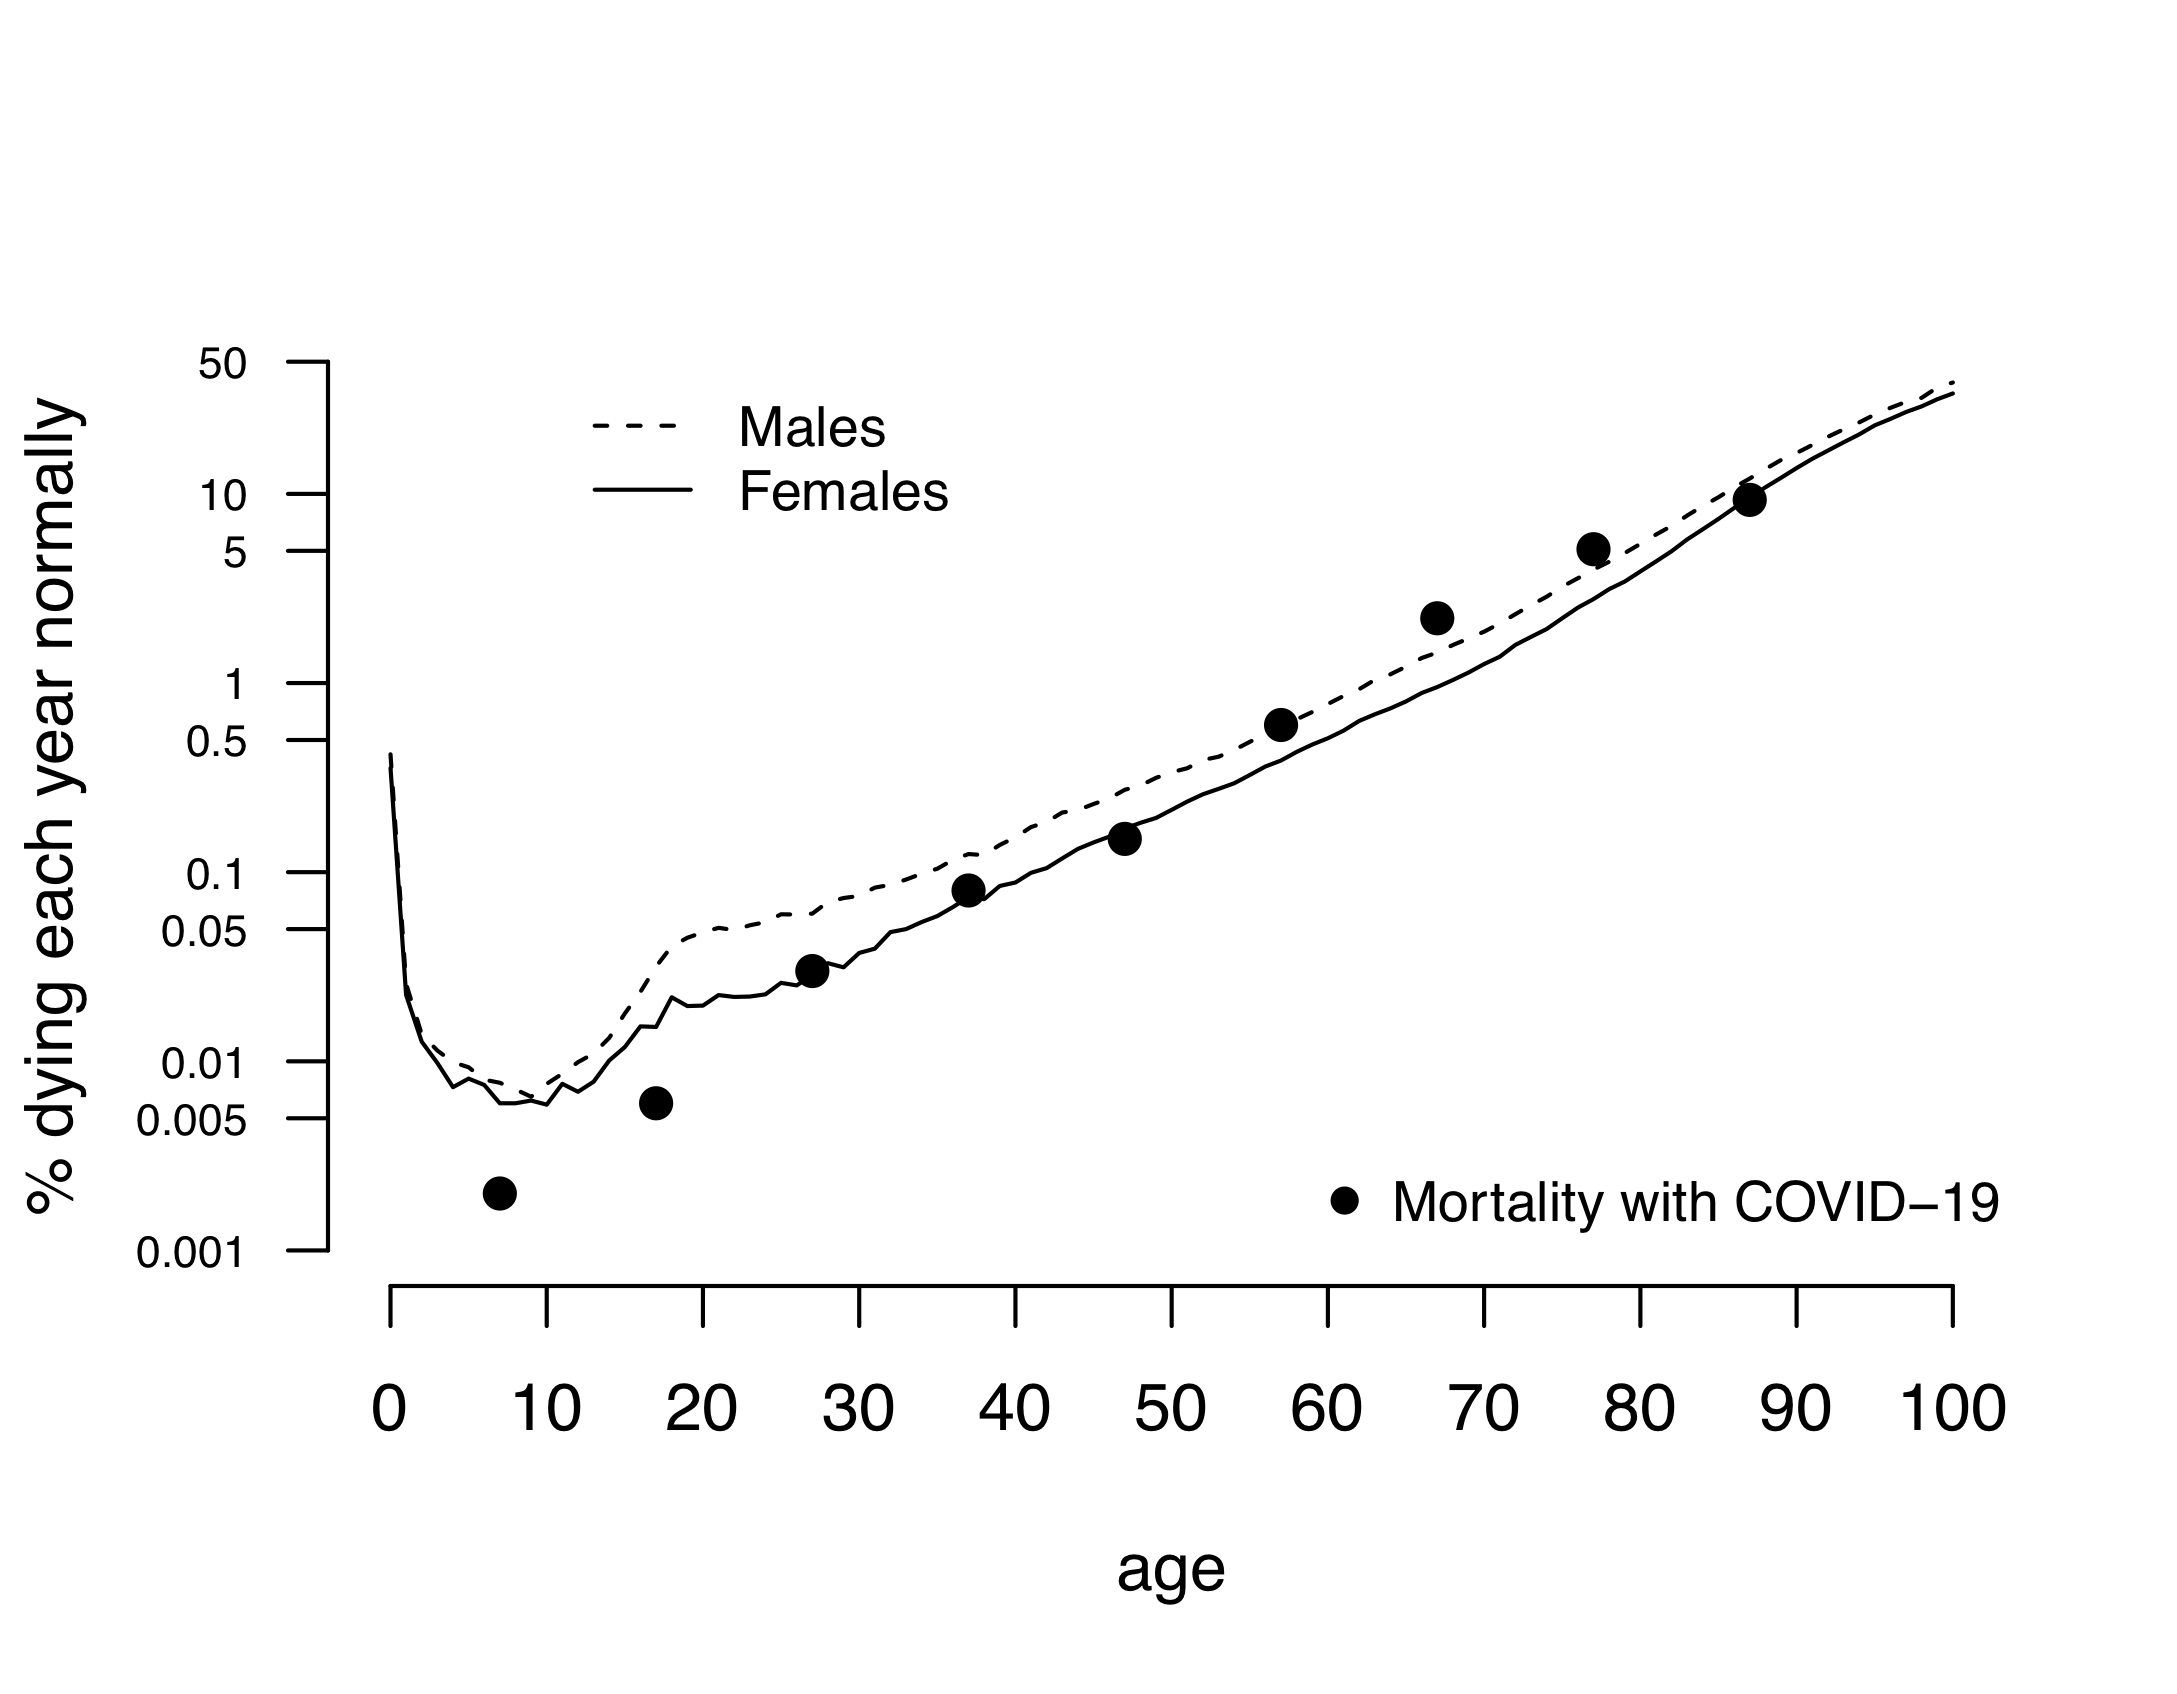
Ordinary all-cause mortality increases with age, and apart from the infant spike and the young-and-stupid bump in the usual death rates it matches the COVID-19 pattern remarkably well.
Different people will draw different messages from this (the data never speak for themselves), but I think it supports the revised message around severity for younger adults. If you’re young and healthy, you are very likely to survive COVID-19 — but part of that is because you’re hard to kill, not because it’s a minor illness. Think of it as like a car crash that would kill a 75 year old but might just give a 25 year old a week in hospital and a few months’ painful recovery.
Thomas Lumley (@tslumley) is Professor of Biostatistics at the University of Auckland. His research interests include semiparametric models, survey sampling, statistical computing, foundations of statistics, and whatever methodological problems his medical collaborators come up with. He also blogs at Biased and Inefficient See all posts by Thomas Lumley »
I wouldn’t expect it to stay like that though – the countries with the least medical services are also the ones with the youngest populations. Although, also the ones to have poorer reporting.
China is unique because of it’s (only recently changed) one child policy and Italy, unusual, because of it’s demographics.
6 years ago
While all the numbers are flying around. I still think the NZ situation is a bit over hyped.
Is there any statistical probability calculations of actually catching the Virus in NZ?
6 years ago
Today, the risk is low. There are likely to be under a thousand undetected cases in the country. Any specific person is unlikely to catch Sars-Cov-2 today. However, there are a lot of people in New Zealand and some of them will catch it today.
Without fairly severe controls on personal contact (plus testing), the number of undetected cases, and so the risk, *will* increase every day. The point of the current alerts is that right now we have a chance to keep it low, with the borders closed and no new cases coming in.
If everything goes perfectly, we will find all the cases and the remaining risk will be very low. We can then relax the controls a lot. If everything goes fairly well, we’ll be able to keep up with new clusters and the risk will be fairly low; we can relax the controls to some extent. If we don’t manage to stop spread at individual clusters, it is very unlikely we can hold the number of cases in New Zealand to under a million by milder physical distancing — a million cases would correspond to a ‘flattened’ epidemic with each person infecting an average of about 1.25 other people. With no controls at all, we’d expect three or four million cases *in New Zealand* before the epidemic is over.
You’d need to talk to economists and social workers and so about whether the current interventions are worth a month of lockdown and maybe 18 months with varying alert levels. The ones I follow on Twitter seem to think so.
6 years ago
The chances of being infected in NZ right now are probably quite low, but they must be kept that way. Once contact tracing becomes impossible because of too many infections all bets are off and you are Italy or worse.
Believe it, this is serious. I suggest a couple of reads if you don’t believe me. The second is very long but you don’t have to get very far to get the message.
https://www.newsroom.co.nz/2020/03/18/1087349/simple-common-factor-in-success-against-covid-19-in-asia?fbclid=IwAR2AKDp-GFA-NCQbk0QbsW_GOTJMOkzdo3cH2ikUwp6LSyXTLwWC7sEGJJs
https://medium.com/@tomaspueyo/coronavirus-the-hammer-and-the-dance-be9337092b56
6 years ago
If you look at the log graph of cases here.
https://www.stuff.co.nz/national/health/coronavirus/120542966/coronavirus-greta-thunberg-isolated-on-concerns-she-contracted-the-virus
Apart from China, everyone pretty much has a stagnation period after a few cases but then case numbers take off. On our graph, we have just started the “take-off” part. The graph is probably a day or two day behind because of the time it takes to test and the time it takes to get through the MOH and into the media.
The people who are newly infected now will only show up in the count in about 7 days when their symptoms start to show. So you have to base your response to what you think the graph will look like in 7 days because that is your best guess about what is happening “in the wild”.
If you have to wait 7 days for community spread to show then it’s been community spreading for 7 days – that’s really to long to wait.
The point is the info we see in the newspaper/online is not the information the govt is using to make decisions – so what may seem like an over-reaction is just because we don’t have all the info or not thinking about the ~7 day time horizon.
6 years ago
Without a vaccine, there are only two endpoints to the virus infection: management down to controllable levels, or herd immunity.
If you do a back of the envelope calculation, even with unsure figures, it is easy to come to the conclusion that herd immunity could mean tens of thousand deaths in New Zealand.
New Zealand Population: 5,000,000
Herd Immunity: 70%
Death Rate: 1%
Deaths: 35,000
And remember that is the death rate from the virus alone. If the hospital system is overwhelmed, there will be other deaths which could have been avoided. If the death rate overall went up to 2% you can do the math.
6 years ago
Hmmm. We still don’t know what the denominator is. People will get the virus; it’s probably a matter of how quickly it spreads then how the hospitals will cope with it. ??
6 years ago
We know more than we did about the denominator, thanks to Italy and Iceland doing a lot of testing: the fraction of asymptomatic cases is probably between 50% and 90% — it’s not likely to be, eg, 99%.
It is a matter of how fast it spreads — but we can’t really afford any free spread. If 1% of the population were infected and 1% of those needed ICU treatment, that’s all the ICU we have.
6 years ago
This is an interesting article about why the numerator might not be that clear cut either.
https://talkingpointsmemo.com/edblog/this-is-very-important-from-italy-please-read
6 years ago