March 28, 2020
Briefly
- An opinion poll on the NZ lockdown, at the Spinoff. This is notable for being a self-selected online sample, but not a bogus poll — it’s properly reweighted to population totals for age, gender, and region, and this week being on Facebook or Instagram is probably more representative than answering your phone. Interestingly, 9% of people say they won’t obey the rules, but only 7% say the rules shouldn’t be enforced.
- XKCD has a … unique … way to describe the 2m distancing zone.
- Tableau have graphs of population mobility across the US, purporting to measure the success of social distancing. But they didn’t take interstate highways (where people tend to move rather a lot) into account
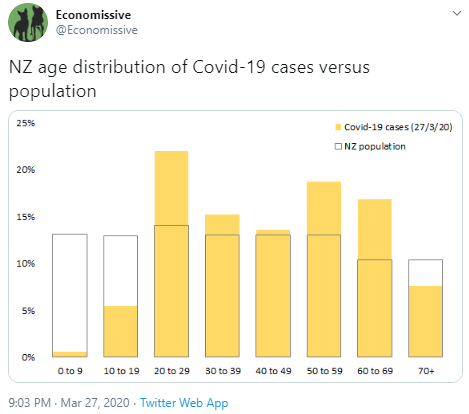
- A good graph of case age distributions in NZ — answering the basic statistical question ‘compared to what’?
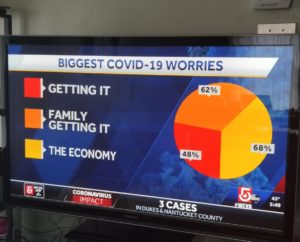
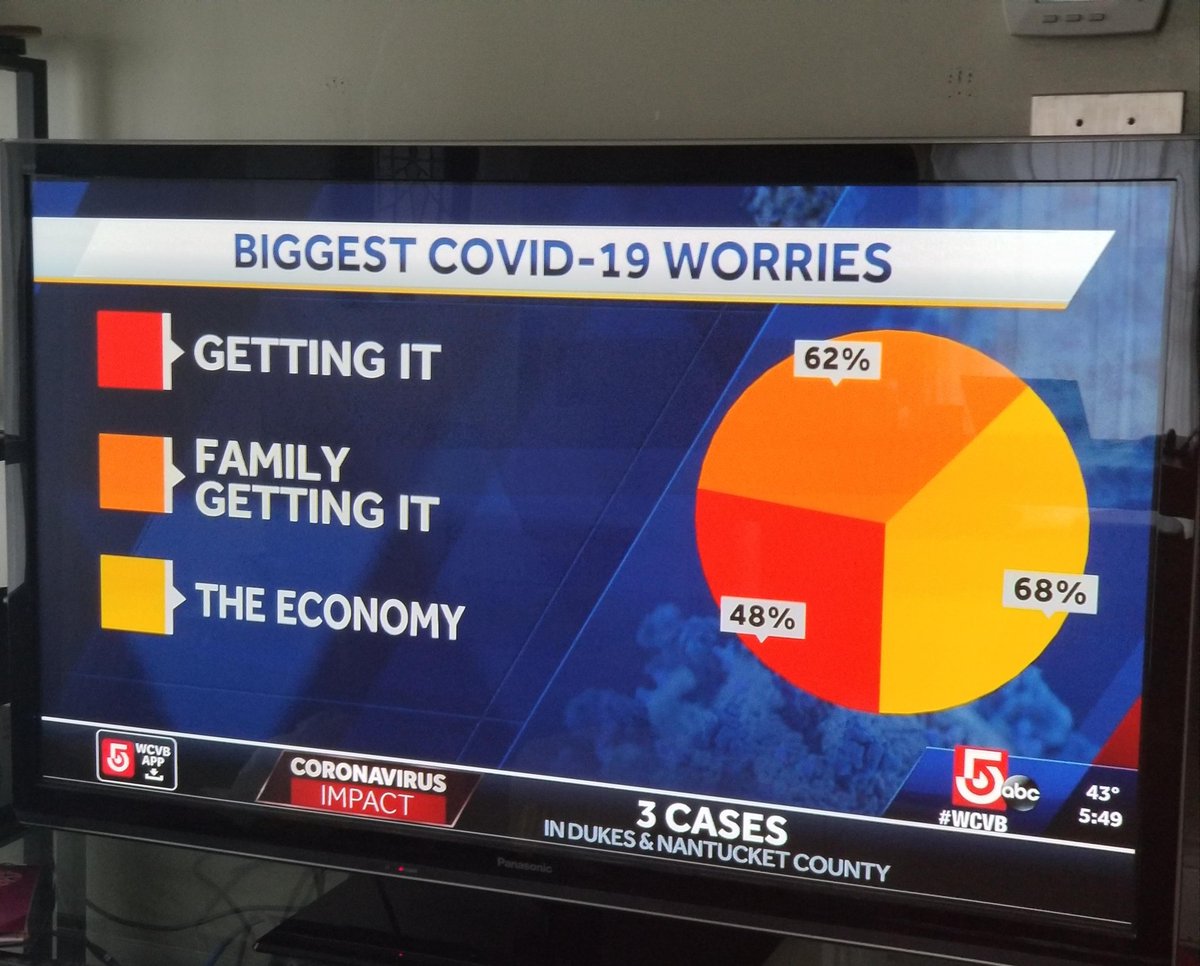
- A terrible pie chart from ABC news in the US, via several people: these aren’t things that add up
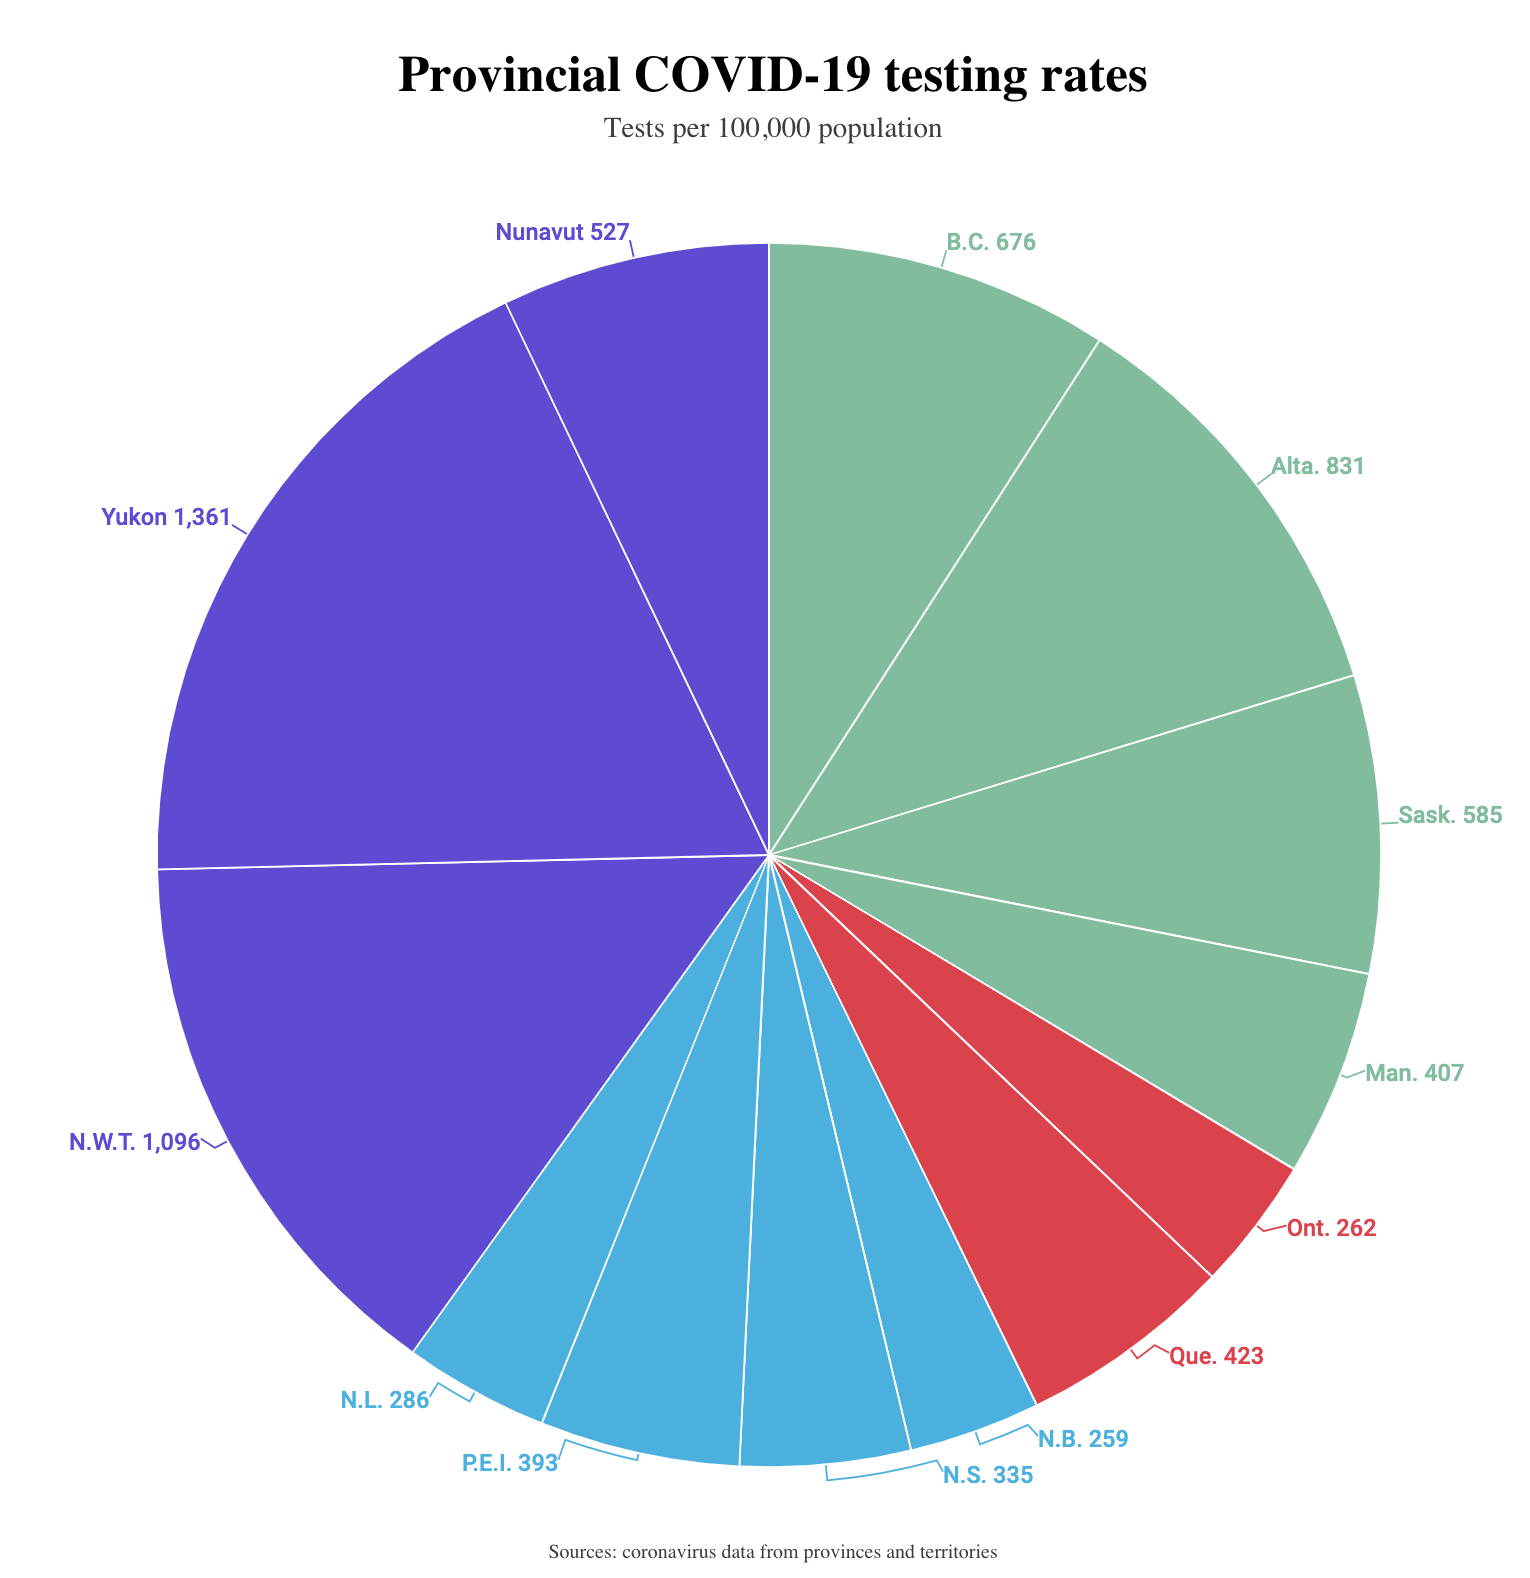
- And from Macleans.ca: rates per 100k population don’t add up either — Yukon, Nunavut, and the Northwest Territories have not actually done a third of Canada’s testing
- On the other hand, this graph of unemployment claims from the New York Times is spectacular. Depressing, but spectacular.

Thomas Lumley (@tslumley) is Professor of Biostatistics at the University of Auckland. His research interests include semiparametric models, survey sampling, statistical computing, foundations of statistics, and whatever methodological problems his medical collaborators come up with. He also blogs at Biased and Inefficient See all posts by Thomas Lumley »