Population density
With NZ’s good-so-far control of the coronavirus, there has been discussion on the internets as to whether New Zealand has high or low population density, and also on whether March/April is summer here or not. The second question is easy. It’s not summer here. The first is harder.
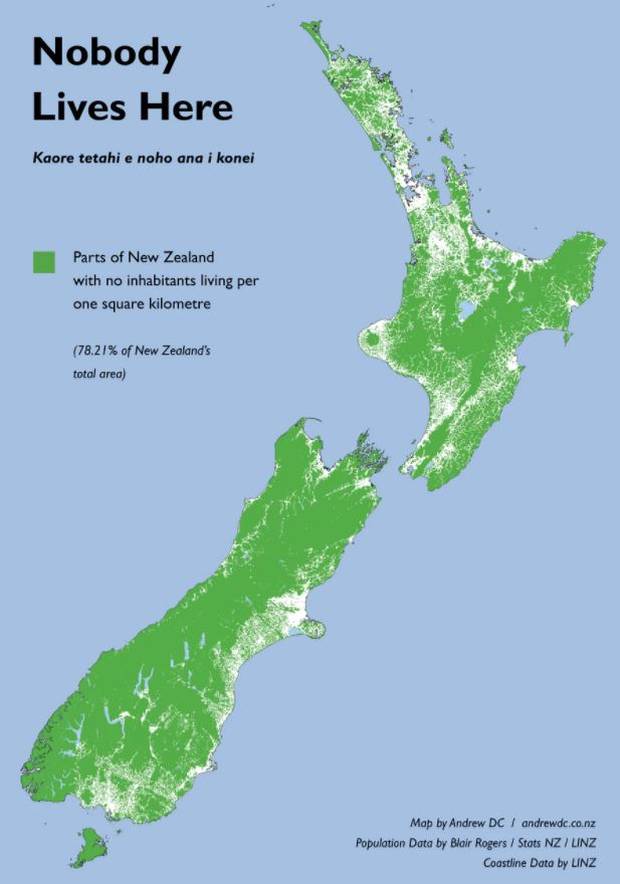
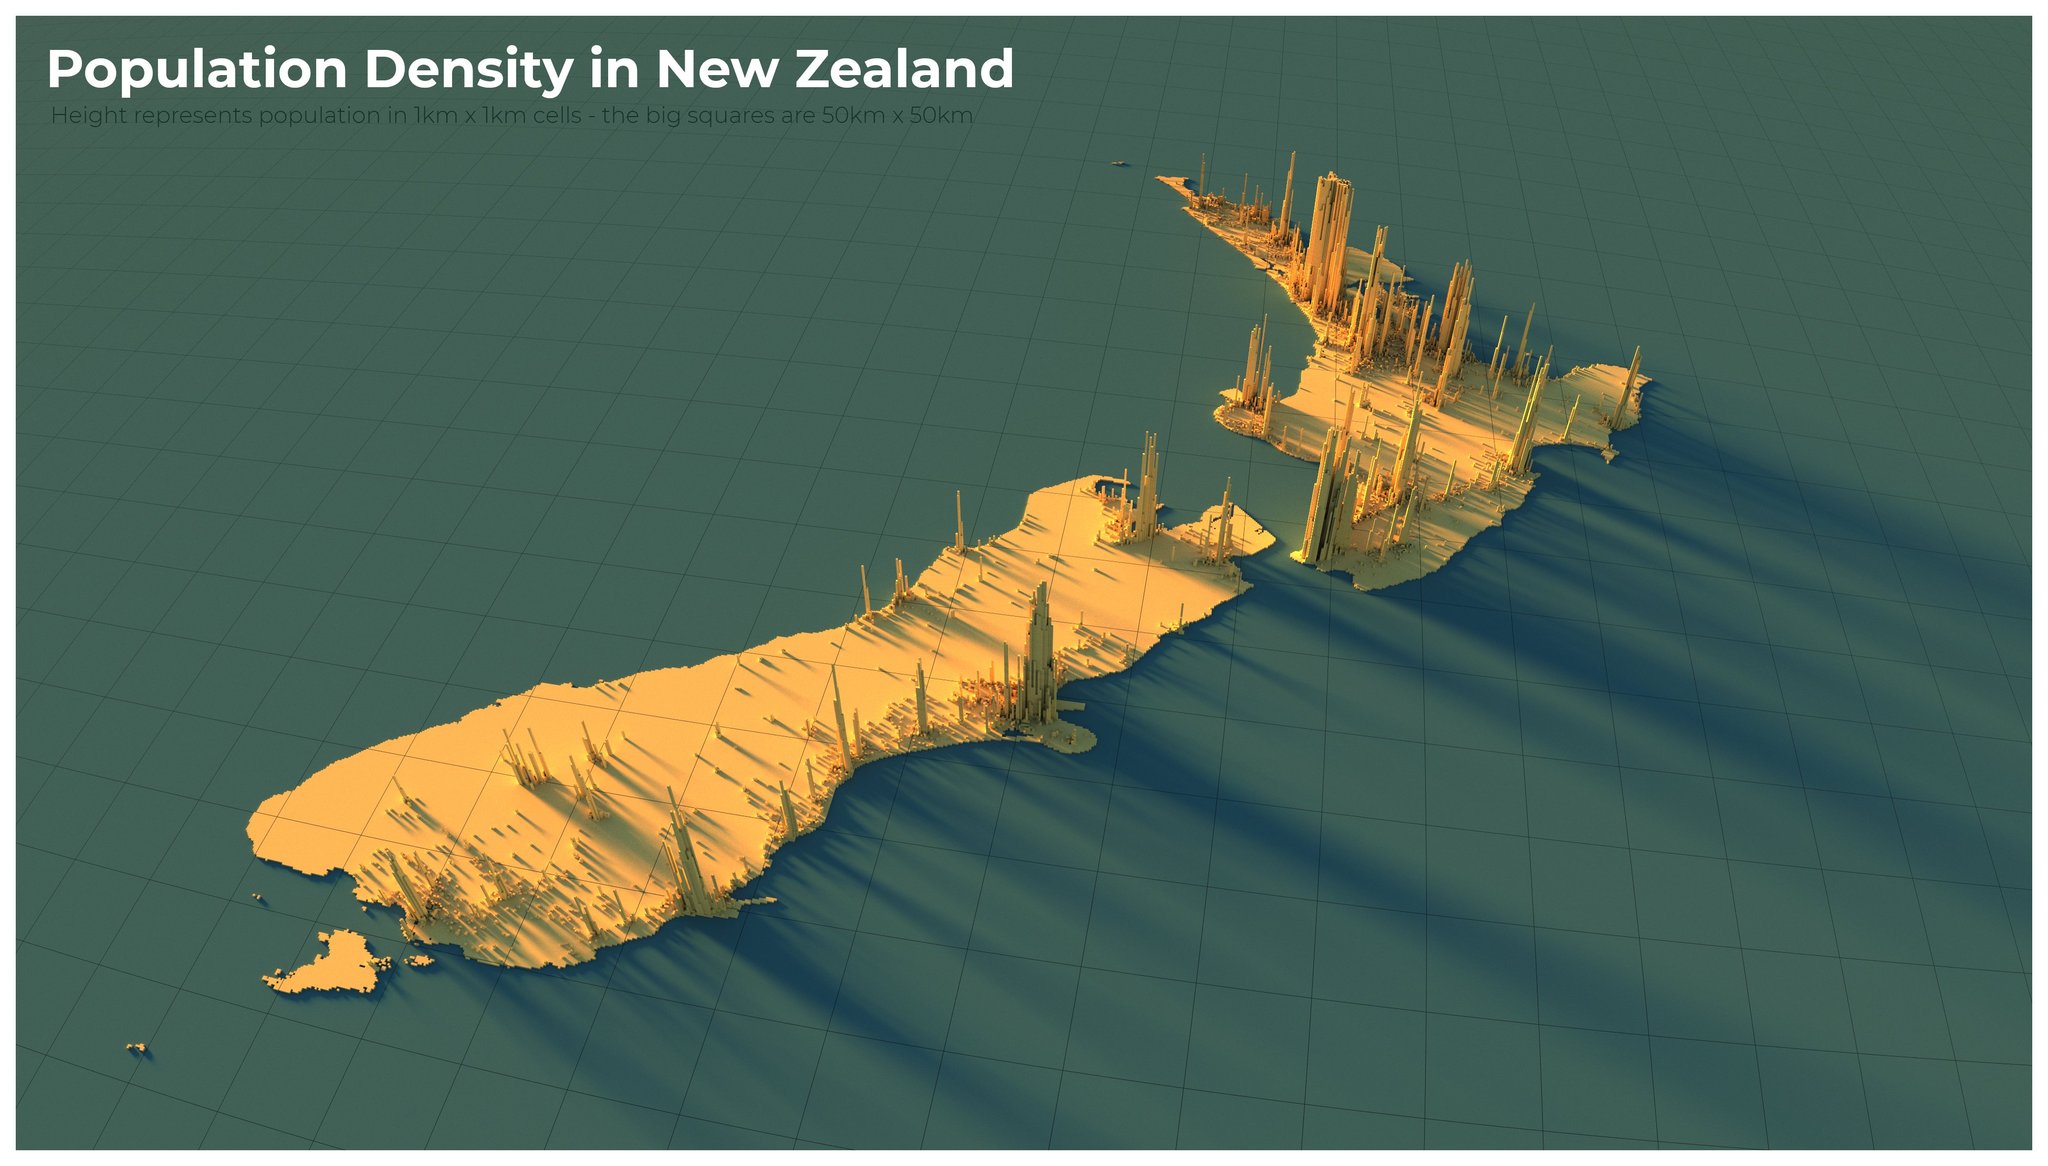
New Zealand’s average population density is very low. It’s lower than the USA. It’s lower than the UK. It’s lower than Italy even if you count the sheep. On the other hand, a lot of New Zealand has no people in it, so the density in places that have people is higher. Here are a couple of maps: “Nobody Lives Here” by Andrew Douglas-Clifford, showing the 78% of the country’s land area with no inhabitants, and a 3-d map of population density by Alasdair Rae (@undertheraedar)
We really should be looking at the population density of inhabited areas. That’s harder than it sounds, because it makes a big difference where you draw the boundaries. Take Dunedin. The local government area goes on for ever in all directions. You can get on an old-fashioned train at the Dunedin station, and travel 75km through countryside and scenic gorges to the historic town of Middlemarch, and you’ll still be in Dunedin. The average population density is 40 people per square kilometre. If you look just within the StatsNZ urban boundary, the average population density is 410/square kilometre — ten times higher.
A better solution is population-weighted density, where you work out the population density where each person lives and average them. Population-weighted density tells you how far away is the average person’s nearest neighbour; how far you can go within bumping into someone else’s bubble.The boundary problem doesn’t matter as much: hardly anyone lives in 90% of Dunedin, so it gets little weight — including or excluding the non-urban area doesn’t affect the average. What does matter is the resolution.
If you work out population weighted densities using 1km squares you will get a larger number than if you use 2km squares, because the 1km square ignores density variation within 1km, and the 2km squares ignore density variation within 2km. If you use census meshblocks you will get a larger number than if you use electorates, and so on. That can be an issue for international comparisons
However, this is a graph of population-weighted density with 1km squares across a wide range of European and Australian cities using 1km square grids, in units of people per hectare:
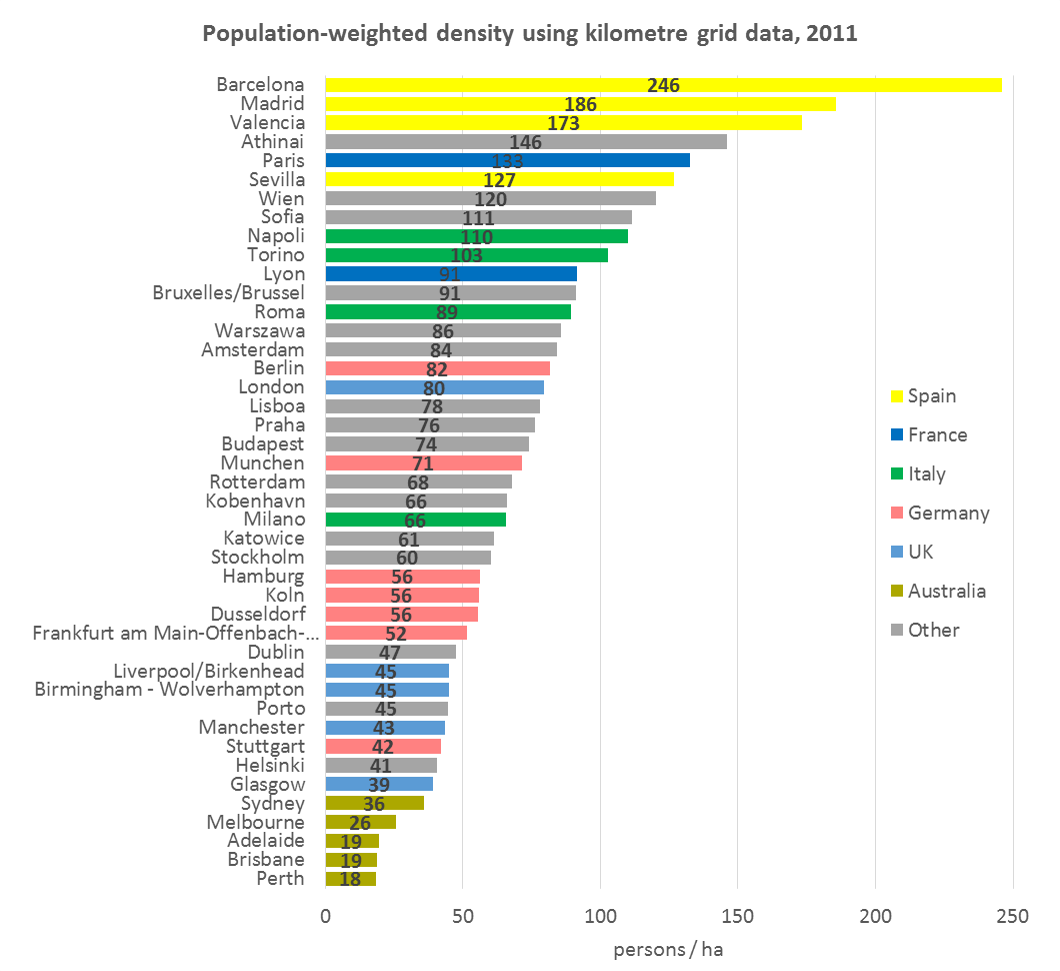
If you compare the Australian and NZ cities using meshblocks, Auckland slots in just behind Melbourne, with Wellington following, and Christchurch is a little lower than Perth. The New York Metropolitan Area is at about 120. Greater LA, the San Francisco Bay Area, and Honolulu, are in the mid-40s, based on Census Bureau data. New York City is at about 200. I couldn’t find data for any Asian cities, but here’s a map of Singapore showing that a lot of people live in areas with population density well over 2000 people per square kilometre, or 200/hectare.
So, yes, New Zealand is more urban than foreigners might think, and Auckland is denser than many US metropolitan areas. But by world standards even Auckland and Wellington are pretty spacious.
Thomas Lumley (@tslumley) is Professor of Biostatistics at the University of Auckland. His research interests include semiparametric models, survey sampling, statistical computing, foundations of statistics, and whatever methodological problems his medical collaborators come up with. He also blogs at Biased and Inefficient See all posts by Thomas Lumley »
Hi Thomas
Is it possible to show a number of Corona cases and/or deaths against density in each of these places?
On face value there looks like there might be a link, but of course, correlation does not imply causation.
There are studies that show seasonality and its effect on indoor temperature, relative humidity, air quality, and ventilation rate have a double effect on virus infectibility and optimum human immune response, plus how far a virus can travel in aerosol form.
But density is the basis of social distancing which is linked to how far the virus HAS to travel.
Thanks
Regards
6 years ago
Hi Thomas
Is it possible to show a number of Corona cases and/or deaths against density in each of these places?
On face value there looks like there might be a link, but of course, correlation does not imply causation.
There are studies that show seasonality and its effect on indoor temperature, relative humidity, air quality, and ventilation rate have a double effect on virus infectibility and optimum human immune response, plus how far a virus can travel in aerosol form.
But density is the basis of social distancing which is linked to how far the virus HAS to travel.
6 years ago
It might be possible, though I don’t know if city level data are available in most places. However, I don’t think it would be informative. The problem is that responses to the pandemic will depend on density and also on number of cases — there’s a feedback. Until recently, Singapore was looking very good despite high density because of tight controls, and New York’s problem is partly density and partly overcrowding and partly having an unfortunate choice of President.
6 years ago
Would be nice to start seeing the C19 data at least at a mesh block level – that would negate the population density issue – and they are reasonably large enough in terms of population to ensure that individuals would not be identified.
6 years ago
I’m not sure they are large enough. A typical SA1 (which is the publishing unit nowadays in NZ) has a population of 100-200 residents, so most of them will have no cases. Identifying a case or a household cluster to the meshblock level is more identifying than would usually be allowed in NZ.
(Also, I still read ‘C19’ as ‘nineteenth century’, even after how ever many years it’s been since February)
6 years ago
There is also the problem of what meshblock to link people too – the place of infection, where they work or where they live. That first seems more sensible but do people know where they were infected? And what about the people who got infected in Bluff at the wedding but live in Wellington, Auckland or the Waikato. Depending on where you place them (infection place or home) – density is likely to be either positively or negatively correlated. And what about people who caught it on a plane (or was it the airport?) where do you put them. Or the people who caught it overseas?
6 years ago