Posts from October 2021 (21)

October 16, 2021

Vaxathon!

Today is the NZ Vaxathon! I had my second dose last week. All the statisticians I’ve talked to on the issue have had either one or two doses depending on when they became eligible.  For fans of anecdata, our experience varied from no adverse effects at all to a day or so feeling pretty bloody average, consistent with what the randomised trial reported.

In the spirit of StatsChat, here are some links to primary sources for anyone who wants to do their own reading rather than getting clinicians and scientists to translate it

  • Official guidance from the US Food and Drug Administration on what sort of evidence they would need to approve a Covid vaccine (June 2020)
  • The protocol (plan) for the Pfizer vaccine trial. It’s unusual for these to be public, but it was reassuring when this one was published last year (PDF)
  • The meeting briefings for the external expert advisory committee meeting that recommended authorisation of the vaccine. You want ‘Briefing Document -FDA’ and ‘Briefing Document -Sponsor’. And if you’re really dedicated, the transcript of the discussion.  This is where you get all the detailed information that doesn’t fit into a published research paper, plus discussion from the medical and scientific experts
  • Real-world effectiveness assessment of the vaccine in Israel. Authors include Miguel Hernán, who is a leading expert on causal inference from observational data
  • What we know about heart inflammation after vaccination: an adverse reaction in about one person per 100,000 aged under 40.  Most recover fully, but there has been one death in New Zealand that was probably due to this.
  • A summary on vaccine effectiveness with links to primary sources, covering effectiveness against Delta, prevention of infection, and prevention of symptomatic disease
  • Vaccination of health care workers in the UK reduced infection rates for their household members
  • A recent study in China (with different vaccines) found vaccinated people were less likely to pass on the virus even with Delta
  • An even more recent UK study looking at the Pfizer and AZ vaccines found the same
 

October 12, 2021

United Rugby Championship Predictions for Week 4

Team Ratings for Week 4

The basic method is described on my Department home page.
Here are the team ratings prior to this week’s games, along with the ratings at the start of the season.

Current Rating Rating at Season Start Difference
Leinster 14.57 14.79 -0.20
Munster 12.41 10.69 1.70
Ulster 8.07 7.41 0.70
Glasgow 3.45 3.69 -0.20
Bulls 2.77 3.65 -0.90
Edinburgh 1.45 2.90 -1.40
Connacht 0.85 1.72 -0.90
Stormers 0.80 0.00 0.80
Sharks 0.34 -0.07 0.40
Cardiff Rugby -0.11 -0.11 -0.00
Ospreys -0.17 0.94 -1.10
Scarlets -0.70 -0.77 0.10
Lions -3.25 -3.91 0.70
Benetton -4.33 -4.50 0.20
Dragons -4.95 -6.92 2.00
Zebre -15.16 -13.47 -1.70


Performance So Far

So far there have been 24 matches played, 19 of which were correctly predicted, a success rate of 79.2%.
Here are the predictions for last week’s games.

Game Date Score Prediction Correct
1 Ospreys vs. Sharks Oct 09 13 – 27 8.10 FALSE
2 Ulster vs. Benetton Oct 09 28 – 8 18.70 TRUE
3 Leinster vs. Zebre Oct 09 43 – 7 36.30 TRUE
4 Glasgow vs. Lions Oct 10 13 – 9 14.40 TRUE
5 Connacht vs. Dragons Oct 10 22 – 35 14.90 FALSE
6 Edinburgh vs. Stormers Oct 10 20 – 20 8.70 FALSE
7 Cardiff Rugby vs. Bulls Oct 10 19 – 29 5.20 FALSE
8 Scarlets vs. Munster Oct 10 13 – 43 -4.20 TRUE


Predictions for Week 4

Here are the predictions for Week 4. The prediction is my estimated expected points difference with a positive margin being a win to the home team, and a negative margin a win to the away team.

Game Date Winner Prediction
1 Dragons vs. Stormers Oct 16 Dragons 0.80
2 Ulster vs. Lions Oct 16 Ulster 17.80
3 Zebre vs. Glasgow Oct 16 Glasgow -12.10
4 Benetton vs. Ospreys Oct 17 Benetton 2.30
5 Edinburgh vs. Bulls Oct 17 Edinburgh 5.20
6 Leinster vs. Scarlets Oct 17 Leinster 21.80
7 Cardiff Rugby vs. Sharks Oct 17 Cardiff Rugby 6.10
8 Munster vs. Connacht Oct 17 Munster 16.60


Top 14 Predictions for Round 7

Team Ratings for Round 7

The basic method is described on my Department home page.
Here are the team ratings prior to this week’s games, along with the ratings at the start of the season.

Current Rating Rating at Season Start Difference
Stade Toulousain 8.45 6.83 1.60
La Rochelle 6.96 6.78 0.20
Lyon Rugby 5.85 4.15 1.70
Bordeaux-Begles 5.82 5.42 0.40
Racing-Metro 92 5.66 6.13 -0.50
Clermont Auvergne 4.07 5.09 -1.00
Montpellier 1.74 -0.01 1.70
RC Toulonnais 0.89 1.82 -0.90
Castres Olympique 0.38 0.94 -0.60
Stade Francais Paris 0.08 1.20 -1.10
Section Paloise -2.08 -2.25 0.20
Brive -2.43 -3.19 0.80
USA Perpignan -3.89 -2.78 -1.10
Biarritz -4.15 -2.78 -1.40


Performance So Far

So far there have been 42 matches played, 33 of which were correctly predicted, a success rate of 78.6%.
Here are the predictions for last week’s games.

Game Date Score Prediction Correct
1 Biarritz vs. Lyon Rugby Oct 10 5 – 40 -1.50 TRUE
2 Bordeaux-Begles vs. Montpellier Oct 10 27 – 23 11.30 TRUE
3 La Rochelle vs. Castres Olympique Oct 10 29 – 10 12.40 TRUE
4 Racing-Metro 92 vs. USA Perpignan Oct 10 17 – 14 17.00 TRUE
5 Stade Francais Paris vs. Clermont Auvergne Oct 10 22 – 14 1.90 TRUE
6 Stade Toulousain vs. Section Paloise Oct 10 38 – 10 16.20 TRUE
7 RC Toulonnais vs. Brive Oct 10 13 – 9 10.50 TRUE


Predictions for Round 7

Here are the predictions for Round 7. The prediction is my estimated expected points difference with a positive margin being a win to the home team, and a negative margin a win to the away team.

Game Date Winner Prediction
1 Brive vs. La Rochelle Oct 17 La Rochelle -2.90
2 Castres Olympique vs. Biarritz Oct 17 Castres Olympique 11.00
3 Lyon Rugby vs. Stade Toulousain Oct 17 Lyon Rugby 3.90
4 Montpellier vs. Clermont Auvergne Oct 17 Montpellier 4.20
5 Section Paloise vs. Bordeaux-Begles Oct 17 Bordeaux-Begles -1.40
6 RC Toulonnais vs. Racing-Metro 92 Oct 17 RC Toulonnais 1.70
7 USA Perpignan vs. Stade Francais Paris Oct 17 USA Perpignan 2.50


Rugby Premiership Predictions for Round 5

Team Ratings for Round 5

The basic method is described on my Department home page.
Here are the team ratings prior to this week’s games, along with the ratings at the start of the season.

Current Rating Rating at Season Start Difference
Exeter Chiefs 7.15 7.35 -0.20
Wasps 6.00 5.66 0.30
Sale Sharks 3.23 4.96 -1.70
Bath 1.31 2.14 -0.80
Harlequins 0.29 -1.08 1.40
Northampton Saints -1.23 -2.48 1.30
Gloucester -1.73 -1.02 -0.70
Bristol -2.22 1.28 -3.50
Saracens -2.83 -5.00 2.20
Newcastle Falcons -3.10 -3.52 0.40
Leicester Tigers -4.00 -6.14 2.10
Worcester Warriors -6.74 -5.71 -1.00
London Irish -7.75 -8.05 0.30


Performance So Far

So far there have been 24 matches played, 12 of which were correctly predicted, a success rate of 50%.
Here are the predictions for last week’s games.

Game Date Score Prediction Correct
1 Harlequins vs. Bristol Oct 09 52 – 24 4.70 TRUE
2 Exeter Chiefs vs. Worcester Warriors Oct 10 42 – 5 16.30 TRUE
3 Gloucester vs. Sale Sharks Oct 10 33 – 32 -0.70 FALSE
4 London Irish vs. Leicester Tigers Oct 10 16 – 21 1.50 FALSE
5 Saracens vs. Newcastle Falcons Oct 10 37 – 23 3.60 TRUE
6 Wasps vs. Northampton Saints Oct 11 26 – 20 12.50 TRUE


Predictions for Round 5

Here are the predictions for Round 5. The prediction is my estimated expected points difference with a positive margin being a win to the home team, and a negative margin a win to the away team.

Game Date Winner Prediction
1 Sale Sharks vs. Harlequins Oct 16 Sale Sharks 7.40
2 Newcastle Falcons vs. Bristol Oct 17 Newcastle Falcons 3.60
3 Wasps vs. Exeter Chiefs Oct 17 Wasps 3.30
4 Worcester Warriors vs. Leicester Tigers Oct 17 Worcester Warriors 1.80
5 Bath vs. Saracens Oct 18 Bath 8.60
6 London Irish vs. Gloucester Oct 18 Gloucester -1.50


Bunnings NPC Predictions for Round 11

Team Ratings for Round 11

The basic method is described on my Department home page.
Here are the team ratings prior to this week’s games, along with the ratings at the start of the season.

Current Rating Rating at Season Start Difference
Tasman 9.67 10.71 -1.00
Auckland 8.62 7.95 0.70
Wellington 5.70 5.62 0.10
Hawke’s Bay 5.49 4.07 1.40
Waikato 4.35 2.52 1.80
Canterbury 4.29 6.44 -2.10
North Harbour 4.04 5.75 -1.70
Bay of Plenty 2.79 5.20 -2.40
Taranaki 2.16 -4.52 6.70
Otago -6.08 -3.47 -2.60
Northland -8.52 -4.75 -3.80
Manawatu -9.27 -14.72 5.50
Counties Manukau -11.10 -10.22 -0.90
Southland -11.97 -10.39 -1.60


Performance So Far

So far there have been 31 matches played, 18 of which were correctly predicted, a success rate of 58.1%.
Here are the predictions for last week’s games.

Game Date Score Prediction Correct
1 Wellington vs. Canterbury Oct 08 35 – 30 4.90 TRUE
2 Hawke’s Bay vs. Tasman Oct 09 34 – 22 -2.70 FALSE
3 Otago vs. Taranaki Oct 09 23 – 30 -4.30 TRUE
4 Southland vs. Manawatu Oct 10 27 – 38 2.70 FALSE


Predictions for Round 11

Here are the predictions for Round 11. The prediction is my estimated expected points difference with a positive margin being a win to the home team, and a negative margin a win to the away team.

Game Date Winner Prediction
1 Northland vs. Otago Oct 15 Northland 1.10
2 Canterbury vs. Hawke’s Bay Oct 16 Canterbury 2.30
3 Waikato vs. Taranaki Oct 16 Waikato 5.70
4 Manawatu vs. Wellington Oct 16 Wellington -11.50


October 11, 2021

Vaccine percentages

A few assorted issues:

First, the denominator questions — not the question of the actual population of NZ, which Henry Cooke is in charge of, but the eligibility and ethnicity questions.

Should we be quoting vaccination as a percentage of those eligible or as a percentage of the population? Yes, both. They answer two different important questions.  There’s a question of epidemic dynamics: are we getting to a point where enough people are vaccinated for Delta to be controllable more easily? What’s relevant there is vaccination as a percentage of the population; kids still count as unvaccinated, even though they aren’t eligible. There’s also a social question: are we providing the right access, information, and incentives to get people vaccinated? What’s relevant there is vaccination as a percentage of those eligible.

Next, ethnicity. I’ve seen people asking how ethnicity is counted in the MoH reports. Most of the NZ government tries to count people according to all the ethnicities they identify with — you can be in multiple categories. As a result, the categories add up to more than 100% of the population. The Ministry of Health does something different. If you give them multiple ethnicities, they pick one.  They prioritise: you’re Māori if that’s one of your ethnicities; you’re Pacific if that’s one of your ethnicities and Māori isn’t; you’re Asian if that’s one of your ethnicities and Māori and Pacific both aren’t, and so on. The advantage of this is that subgroups add up nicely: the number of vaccinations overall is the sum  of the numbers in each ethnic group. The disadvantage is that you may not be in the group or groups you expect.

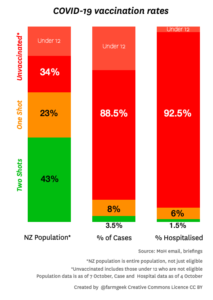
Finally, pictures like this (this one is from @farmgeek on Twitter)

This is aiming to show the protective effect of vaccines. It’s a lot better than just reporting the % vaccinated among cases or hospitalised cases, because it shows the denominator.  The ratio of the red:green ratios in two bars is an estimate of one aspect of vaccine effectiveness; you can see it’s big.

It’s not a perfect estimate, for two reasons. The first is differences in exposure. If people who are unvaccinated are also more likely to be exposed, the vaccine will look more effective than it is; if people who are unvaccinated are less likely to be exposed the vaccine will look less effective than it is.  Both of these are likely: vaccination and exposure is broadly higher in Auckland than in the rest of the country, but within Auckland vaccination is  higher in areas where exposure is probably lower.

On top of any differences in exposure, a graph like this underestimates the impact of the vaccine because it misses out the reduction in unvaccinated cases due to the vaccine. Getting vaccinated protects you, but as the vaccination rates slowly rise, getting vaccinated also increasingly protects other people, regardless of their vaccination status.  Measles is a good example here: vaccinated people are almost never hospitalised for measles, because the vaccine protects us, but very few unvaccinated people are hospitalised for measles because community vaccination levels slow the outbreaks down enough for testing and tracing to control them.

October 5, 2021

United Rugby Championship Predictions for Week 3

Team Ratings for Week 3

The basic method is described on my Department home page.
Here are the team ratings prior to this week’s games, along with the ratings at the start of the season.

Current Rating Rating at Season Start Difference
Leinster 14.60 14.79 -0.20
Munster 11.20 10.69 0.50
Ulster 7.95 7.41 0.50
Glasgow 4.04 3.69 0.40
Edinburgh 2.24 2.90 -0.70
Connacht 2.14 1.72 0.40
Bulls 1.97 3.65 -1.70
Ospreys 0.91 0.94 -0.00
Cardiff Rugby 0.69 -0.11 0.80
Scarlets 0.51 -0.77 1.30
Stormers 0.01 0.00 0.00
Sharks -0.74 -0.07 -0.70
Lions -3.83 -3.91 0.10
Benetton -4.21 -4.50 0.30
Dragons -6.24 -6.92 0.70
Zebre -15.19 -13.47 -1.70


Performance So Far

So far there have been 16 matches played, 15 of which were correctly predicted, a success rate of 93.8%.
Here are the predictions for last week’s games.

Game Date Score Prediction Correct
1 Connacht vs. Bulls Oct 02 34 – 7 4.50 TRUE
2 Scarlets vs. Lions Oct 02 36 – 13 9.40 TRUE
3 Benetton vs. Edinburgh Oct 02 28 – 27 -0.20 FALSE
4 Dragons vs. Leinster Oct 02 6 – 7 -15.90 TRUE
5 Glasgow vs. Sharks Oct 03 35 – 24 11.30 TRUE
6 Zebre vs. Ulster Oct 03 3 – 36 -14.80 TRUE
7 Munster vs. Stormers Oct 03 34 – 18 18.10 TRUE
8 Ospreys vs. Cardiff Rugby Oct 03 18 – 14 5.50 TRUE


Predictions for Week 3

Here are the predictions for Week 3. The prediction is my estimated expected points difference with a positive margin being a win to the home team, and a negative margin a win to the away team.

Game Date Winner Prediction
1 Ospreys vs. Sharks Oct 09 Ospreys 8.10
2 Ulster vs. Benetton Oct 09 Ulster 18.70
3 Leinster vs. Zebre Oct 09 Leinster 36.30
4 Glasgow vs. Lions Oct 10 Glasgow 14.40
5 Connacht vs. Dragons Oct 10 Connacht 14.90
6 Edinburgh vs. Stormers Oct 10 Edinburgh 8.70
7 Cardiff Rugby vs. Bulls Oct 10 Cardiff Rugby 5.20
8 Scarlets vs. Munster Oct 10 Munster -4.20


Top 14 Predictions for Round 6

Team Ratings for Round 6

The basic method is described on my Department home page.
Here are the team ratings prior to this week’s games, along with the ratings at the start of the season.

Current Rating Rating at Season Start Difference
Stade Toulousain 8.04 6.83 1.20
La Rochelle 6.63 6.78 -0.20
Bordeaux-Begles 6.19 5.42 0.80
Racing-Metro 92 6.13 6.13 -0.00
Lyon Rugby 4.86 4.15 0.70
Clermont Auvergne 4.38 5.09 -0.70
Montpellier 1.37 -0.01 1.40
RC Toulonnais 1.22 1.82 -0.60
Castres Olympique 0.71 0.94 -0.20
Stade Francais Paris -0.22 1.20 -1.40
Section Paloise -1.67 -2.25 0.60
Brive -2.75 -3.19 0.40
Biarritz -3.16 -2.78 -0.40
USA Perpignan -4.36 -2.78 -1.60


Performance So Far

So far there have been 35 matches played, 26 of which were correctly predicted, a success rate of 74.3%.
Here are the predictions for last week’s games.

Game Date Score Prediction Correct
1 Brive vs. Stade Francais Paris Oct 02 19 – 12 3.60 TRUE
2 Lyon Rugby vs. Bordeaux-Begles Oct 02 15 – 20 5.90 FALSE
3 Montpellier vs. La Rochelle Oct 02 21 – 11 0.30 TRUE
4 USA Perpignan vs. Section Paloise Oct 02 14 – 29 5.10 FALSE
5 Biarritz vs. Stade Toulousain Oct 03 11 – 17 -4.60 TRUE
6 Castres Olympique vs. RC Toulonnais Oct 03 27 – 16 5.40 TRUE
7 Clermont Auvergne vs. Racing-Metro 92 Oct 04 26 – 17 4.30 TRUE


Predictions for Round 6

Here are the predictions for Round 6. The prediction is my estimated expected points difference with a positive margin being a win to the home team, and a negative margin a win to the away team.

Game Date Winner Prediction
1 Biarritz vs. Lyon Rugby Oct 10 Lyon Rugby -1.50
2 Bordeaux-Begles vs. Montpellier Oct 10 Bordeaux-Begles 11.30
3 La Rochelle vs. Castres Olympique Oct 10 La Rochelle 12.40
4 Racing-Metro 92 vs. USA Perpignan Oct 10 Racing-Metro 92 17.00
5 Stade Francais Paris vs. Clermont Auvergne Oct 10 Stade Francais Paris 1.90
6 Stade Toulousain vs. Section Paloise Oct 10 Stade Toulousain 16.20
7 RC Toulonnais vs. Brive Oct 10 RC Toulonnais 10.50


Rugby Premiership Predictions for Round 4

Team Ratings for Round 4

The basic method is described on my Department home page.
Here are the team ratings prior to this week’s games, along with the ratings at the start of the season.

Current Rating Rating at Season Start Difference
Wasps 6.39 5.66 0.70
Exeter Chiefs 6.09 7.35 -1.30
Sale Sharks 3.37 4.96 -1.60
Bath 1.31 2.14 -0.80
Harlequins -0.87 -1.08 0.20
Bristol -1.06 1.28 -2.30
Northampton Saints -1.63 -2.48 0.90
Gloucester -1.87 -1.02 -0.80
Newcastle Falcons -2.51 -3.52 1.00
Saracens -3.41 -5.00 1.60
Leicester Tigers -4.40 -6.14 1.70
Worcester Warriors -5.68 -5.71 0.00
London Irish -7.35 -8.05 0.70


Performance So Far

So far there have been 18 matches played, 8 of which were correctly predicted, a success rate of 44.4%.
Here are the predictions for last week’s games.

Game Date Score Prediction Correct
1 Bristol vs. Bath Oct 02 25 – 20 1.60 TRUE
2 Northampton Saints vs. London Irish Oct 02 23 – 21 11.30 TRUE
3 Leicester Tigers vs. Saracens Oct 03 13 – 12 4.00 TRUE
4 Newcastle Falcons vs. Wasps Oct 03 18 – 14 -5.50 FALSE
5 Worcester Warriors vs. Gloucester Oct 03 23 – 31 1.80 FALSE
6 Sale Sharks vs. Exeter Chiefs Oct 04 15 – 25 3.20 FALSE


Predictions for Round 4

Here are the predictions for Round 4. The prediction is my estimated expected points difference with a positive margin being a win to the home team, and a negative margin a win to the away team.

Game Date Winner Prediction
1 Harlequins vs. Bristol Oct 09 Harlequins 4.70
2 Exeter Chiefs vs. Worcester Warriors Oct 10 Exeter Chiefs 16.30
3 Gloucester vs. Sale Sharks Oct 10 Sale Sharks -0.70
4 London Irish vs. Leicester Tigers Oct 10 London Irish 1.50
5 Saracens vs. Newcastle Falcons Oct 10 Saracens 3.60
6 Wasps vs. Northampton Saints Oct 11 Wasps 12.50


Bunnings NPC Predictions for Round 10

Team Ratings for Round 10

The basic method is described on my Department home page.
Here are the team ratings prior to this week’s games, along with the ratings at the start of the season.


Current Rating Rating at Season Start Difference
Tasman 10.69 10.71 -0.00
Auckland 8.62 7.95 0.70
Wellington 5.69 5.62 0.10
Hawke’s Bay 4.48 4.07 0.40
Waikato 4.35 2.52 1.80
Canterbury 4.30 6.44 -2.10
North Harbour 4.04 5.75 -1.70
Bay of Plenty 2.79 5.20 -2.40
Taranaki 1.92 -4.52 6.40
Otago -5.83 -3.47 -2.40
Northland -8.52 -4.75 -3.80
Manawatu -10.22 -14.72 4.50
Southland -11.02 -10.39 -0.60
Counties Manukau -11.10 -10.22 -0.90


Performance So Far

So far there have been 27 matches played, 16 of which were correctly predicted, a success rate of 59.3%.
Here are the predictions for last week’s games.


Game Date Score Prediction Correct
1 Northland vs. Waikato Oct 02 38 – 28 -12.30 FALSE
2 Manawatu vs. Otago Oct 02 27 – 14 -3.10 FALSE
3 Bay of Plenty vs. Wellington Oct 02 33 – 32 0.50 TRUE
4 Tasman vs. Southland Oct 03 51 – 14 23.30 TRUE


Predictions for Round 10

Here are the predictions for Round 10. The prediction is my estimated expected points difference with a positive margin being a win to the home team, and a negative margin a win to the away team.


Game Date Winner Prediction
1 Wellington vs. Canterbury Oct 08 Wellington 4.90
2 Hawke’s Bay vs. Tasman Oct 09 Tasman -2.70
3 Otago vs. Taranaki Oct 09 Taranaki -4.30
4 Southland vs. Manawatu Oct 10 Southland 2.70