April 13, 2022
Ross Ihaka talks to Te Ao—Māori News
Watch Ross Ihaka talk to Ximena Smith about R and other things:
https://www.teaomaori.news/statistics-legend-ross-ihaka-reflects-on-his-revolutionary-software
Watch Ross Ihaka talk to Ximena Smith about R and other things:
https://www.teaomaori.news/statistics-legend-ross-ihaka-reflects-on-his-revolutionary-software
The basic method is described on my Department home page.
Here are the team ratings prior to this week’s games, along with the ratings at the start of the season.
| Current Rating | Rating at Season Start | Difference | |
|---|---|---|---|
| Crusaders | 13.99 | 13.43 | 0.60 |
| Blues | 10.75 | 9.26 | 1.50 |
| Hurricanes | 7.43 | 8.28 | -0.80 |
| Chiefs | 7.21 | 5.56 | 1.60 |
| Highlanders | 5.01 | 6.54 | -1.50 |
| Brumbies | 3.81 | 3.61 | 0.20 |
| Reds | 2.42 | 1.37 | 1.00 |
| Western Force | -4.50 | -4.96 | 0.50 |
| Waratahs | -5.73 | -9.00 | 3.30 |
| Rebels | -7.33 | -5.79 | -1.50 |
| Moana Pasifika | -11.31 | -10.00 | -1.30 |
| Fijian Drua | -13.45 | -10.00 | -3.40 |
So far there have been 84 matches played, 31 of which were correctly predicted, a success rate of 36.9%.
Here are the predictions for last week’s games.
| Game | Date | Score | Prediction | Correct | |
|---|---|---|---|---|---|
| 1 | Hurricanes vs. Moana Pasifika | Apr 12 | 53 – 12 | 22.30 | TRUE |
Here are the predictions for Week 9. The prediction is my estimated expected points difference with a positive margin being a win to the home team, and a negative margin a win to the away team.
| Game | Date | Winner | Prediction | |
|---|---|---|---|---|
| 1 | Crusaders vs. Blues | Apr 15 | Crusaders | 8.70 |
| 2 | Rebels vs. Reds | Apr 15 | Reds | -4.30 |
| 3 | Moana Pasifika vs. Chiefs | Apr 16 | Chiefs | -13.00 |
| 4 | Highlanders vs. Hurricanes | Apr 16 | Highlanders | 3.10 |
| 5 | Western Force vs. Waratahs | Apr 16 | Western Force | 6.70 |
For a second week all the result predictions have been correct which seems to have generated a lot of interest and some comments.
Please be aware this is a rare event. I have been predicting Super Rugby and NRL for 10 years and getting all results correct is rare enough but never before have I had all results correct two weeks in a row. For me it is simply an example of a fact about rare events. Even if the probability of an outcome is low, if you repeat the action many times it is likely that the outcome will occur.
Regarding the correctness of my predictions, all I will say is that over the course of a season, it is likely that I will get a bit over 70% of correct results. That is what I have observed over a number of years for different competitions but that can vary a lot as well. For many years I was unable to get to 70% correct predictions for the NRL. Currently my predictions for the Rugby Premiership are only 54% correct.
My purpose in posting these predictions has been to illustrate the efficacy of a very simple statistical method of forecasting. The predictions are also an illustration of what can happen with random events. It can appear that there is a consistent pattern which can be exploited even over what seems to be a considerable time. Never believe that you can beat randomness: it will come back to bite you.
Against my usual practice I won’t publish or comment on all submitted comments this week.
The basic method is described on my Department home page.
Here are the team ratings prior to this week’s games, along with the ratings at the start of the season.
| Current Rating | Rating at Season Start | Difference | |
|---|---|---|---|
| Storm | 17.05 | 19.20 | -2.20 |
| Panthers | 14.57 | 14.26 | 0.30 |
| Rabbitohs | 12.83 | 15.81 | -3.00 |
| Sea Eagles | 8.94 | 10.99 | -2.10 |
| Eels | 5.06 | 2.54 | 2.50 |
| Roosters | 2.77 | 2.23 | 0.50 |
| Sharks | 1.65 | -1.10 | 2.80 |
| Titans | -1.00 | 1.05 | -2.00 |
| Raiders | -2.65 | -1.10 | -1.50 |
| Knights | -5.47 | -6.54 | 1.10 |
| Dragons | -7.73 | -7.99 | 0.30 |
| Warriors | -8.45 | -8.99 | 0.50 |
| Broncos | -8.74 | -8.90 | 0.20 |
| Cowboys | -9.44 | -12.27 | 2.80 |
| Bulldogs | -10.03 | -10.25 | 0.20 |
| Wests Tigers | -11.34 | -10.94 | -0.40 |
So far there have been 40 matches played, 29 of which were correctly predicted, a success rate of 72.5%.
Here are the predictions for last week’s games.
| Game | Date | Score | Prediction | Correct | |
|---|---|---|---|---|---|
| 1 | Knights vs. Sea Eagles | Apr 07 | 6 – 30 | -9.60 | TRUE |
| 2 | Warriors vs. Cowboys | Apr 08 | 25 – 24 | 7.50 | TRUE |
| 3 | Broncos vs. Roosters | Apr 08 | 20 – 24 | -9.40 | TRUE |
| 4 | Raiders vs. Storm | Apr 09 | 16 – 30 | -17.20 | TRUE |
| 5 | Rabbitohs vs. Dragons | Apr 09 | 24 – 12 | 25.20 | TRUE |
| 6 | Titans vs. Eels | Apr 09 | 20 – 26 | -2.50 | TRUE |
| 7 | Sharks vs. Wests Tigers | Apr 10 | 30 – 4 | 14.60 | TRUE |
| 8 | Bulldogs vs. Panthers | Apr 10 | 12 – 32 | -21.90 | TRUE |
Here are the predictions for Round 6. The prediction is my estimated expected points difference with a positive margin being a win to the home team, and a negative margin a win to the away team.
| Game | Date | Winner | Prediction | |
|---|---|---|---|---|
| 1 | Raiders vs. Cowboys | Apr 14 | Raiders | 9.80 |
| 2 | Rabbitohs vs. Bulldogs | Apr 15 | Rabbitohs | 22.90 |
| 3 | Panthers vs. Broncos | Apr 15 | Panthers | 26.30 |
| 4 | Sea Eagles vs. Titans | Apr 16 | Sea Eagles | 12.90 |
| 5 | Storm vs. Sharks | Apr 16 | Storm | 18.40 |
| 6 | Roosters vs. Warriors | Apr 17 | Roosters | 16.70 |
| 7 | Dragons vs. Knights | Apr 17 | Dragons | 0.70 |
| 8 | Eels vs. Wests Tigers | Apr 18 | Eels | 19.40 |
The basic method is described on my Department home page.
Here are the team ratings prior to this week’s games, along with the ratings at the start of the season.
| Current Rating | Rating at Season Start | Difference | |
|---|---|---|---|
| Leinster | 17.18 | 14.79 | 2.40 |
| Munster | 10.28 | 10.69 | -0.40 |
| Ulster | 8.54 | 7.41 | 1.10 |
| Bulls | 6.71 | 3.65 | 3.10 |
| Stormers | 5.45 | 0.00 | 5.40 |
| Edinburgh | 5.05 | 2.90 | 2.20 |
| Sharks | 4.84 | -0.07 | 4.90 |
| Glasgow | 3.38 | 3.69 | -0.30 |
| Scarlets | 0.29 | -0.77 | 1.10 |
| Connacht | -0.56 | 1.72 | -2.30 |
| Lions | -1.45 | -3.91 | 2.50 |
| Ospreys | -2.22 | 0.94 | -3.20 |
| Cardiff Rugby | -5.70 | -0.11 | -5.60 |
| Benetton | -6.38 | -4.50 | -1.90 |
| Dragons | -10.62 | -6.92 | -3.70 |
| Zebre | -18.76 | -13.47 | -5.30 |
So far there have been 115 matches played, 83 of which were correctly predicted, a success rate of 72.2%.
Here are the predictions for last week’s games.
| Game | Date | Score | Prediction | Correct | |
|---|---|---|---|---|---|
| 1 | Stormers vs. Bulls | Apr 10 | 19 – 17 | 4.10 | TRUE |
| 2 | Sharks vs. Lions | Apr 10 | 37 – 10 | 9.50 | TRUE |
| 3 | Cardiff Rugby vs. Scarlets | Apr 10 | 14 – 49 | 2.30 | FALSE |
Here are the predictions for Week 23. The prediction is my estimated expected points difference with a positive margin being a win to the home team, and a negative margin a win to the away team.
| Game | Date | Winner | Prediction | |
|---|---|---|---|---|
| 1 | Scarlets vs. Dragons | Apr 17 | Scarlets | 15.90 |
I will post predictions for this weekend’s game after the postponed game is played tonight.
The basic method is described on my Department home page.
Here are the team ratings prior to this week’s games, along with the ratings at the start of the season.
| Current Rating | Rating at Season Start | Difference | |
|---|---|---|---|
| Crusaders | 13.99 | 13.43 | 0.60 |
| Blues | 10.75 | 9.26 | 1.50 |
| Chiefs | 7.21 | 5.56 | 1.60 |
| Hurricanes | 6.46 | 8.28 | -1.80 |
| Highlanders | 5.01 | 6.54 | -1.50 |
| Brumbies | 3.81 | 3.61 | 0.20 |
| Reds | 2.42 | 1.37 | 1.00 |
| Western Force | -4.50 | -4.96 | 0.50 |
| Waratahs | -5.73 | -9.00 | 3.30 |
| Rebels | -7.33 | -5.79 | -1.50 |
| Moana Pasifika | -10.35 | -10.00 | -0.30 |
| Fijian Drua | -13.45 | -10.00 | -3.40 |
So far there have been 42 matches played, 30 of which were correctly predicted, a success rate of 71.4%.
Here are the predictions for last week’s games.
| Game | Date | Score | Prediction | Correct | |
|---|---|---|---|---|---|
| 1 | Highlanders vs. Moana Pasifika | Apr 08 | 37 – 17 | 21.00 | TRUE |
| 2 | Hurricanes vs. Crusaders | Apr 08 | 21 – 24 | -1.80 | TRUE |
| 3 | Western Force vs. Rebels | Apr 08 | 21 – 22 | 9.50 | FALSE |
| 4 | Chiefs vs. Blues | Apr 09 | 0 – 25 | 4.80 | FALSE |
| 5 | Fijian Drua vs. Brumbies | Apr 09 | 12 – 33 | -10.60 | TRUE |
Here are the predictions for Postponed Games. The prediction is my estimated expected points difference with a positive margin being a win to the home team, and a negative margin a win to the away team.
| Game | Date | Winner | Prediction | |
|---|---|---|---|---|
| 1 | Hurricanes vs. Moana Pasifika | Apr 12 | Hurricanes | 22.30 |
The basic method is described on my Department home page.
Here are the team ratings prior to this week’s games, along with the ratings at the start of the season.
| Current Rating | Rating at Season Start | Difference | |
|---|---|---|---|
| Bulls | 9.91 | 7.25 | 2.70 |
| Cheetahs | 5.03 | -2.70 | 7.70 |
| Sharks | 3.88 | 4.13 | -0.30 |
| Pumas | -0.32 | -3.31 | 3.00 |
| Western Province | -1.86 | 1.42 | -3.30 |
| Griquas | -3.10 | -4.92 | 1.80 |
| Lions | -13.54 | -1.88 | -11.70 |
So far there have been 24 matches played, 19 of which were correctly predicted, a success rate of 79.2%.
Here are the predictions for last week’s games.
| Game | Date | Score | Prediction | Correct | |
|---|---|---|---|---|---|
| 1 | Pumas vs. Lions | Apr 07 | 45 – 10 | 14.60 | TRUE |
| 2 | Griquas vs. Sharks | Apr 07 | 6 – 13 | -1.40 | TRUE |
| 3 | Bulls vs. Western Province | Apr 07 | 45 – 34 | 17.40 | TRUE |
Here are the predictions for Round 9. The prediction is my estimated expected points difference with a positive margin being a win to the home team, and a negative margin a win to the away team.
| Game | Date | Winner | Prediction | |
|---|---|---|---|---|
| 1 | Lions vs. Griquas | Apr 16 | Griquas | -5.90 |
| 2 | Western Province vs. Cheetahs | Apr 16 | Cheetahs | -2.40 |
| 3 | Sharks vs. Bulls | Apr 17 | Bulls | -1.50 |
Last month, the Italian region of Marche announced they had installed ventilation in schools and it had reduced Covid infections by a 82% (Reuters, Stuff, La Repubblica). A report was supposed to follow, but this is all I’ve been able to find. It’s not really surprising that Covid rates went down with improved ventilation, but what’s currently available is very low on detail. Ventilation was installed in 3% of classrooms (or for 3% of classes, I’m not certain), and this 3% was compared to those that didn’t get new ventilation. The reported benefits were:
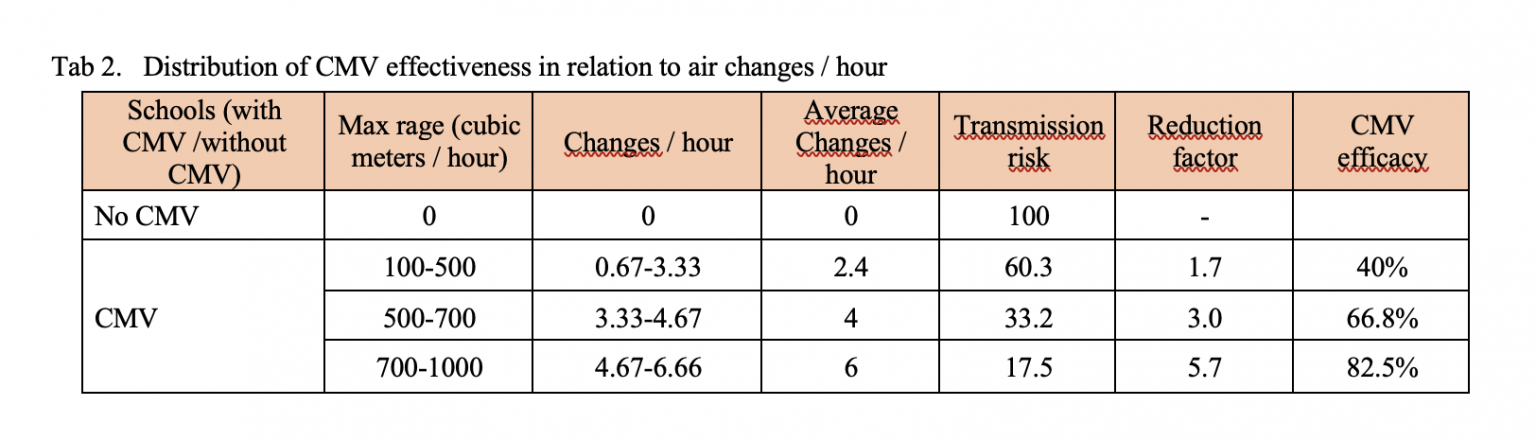
That’s great! But. Things you’d really like to know when you think about how much this should change policy in other countries:
In particular, the relationship between air changes and transmission risk looks very close to what you might expect from just diluting the air — but it really shouldn’t! The ventilation should only have changed Covid risk while students were at school; it shouldn’t have reduced the risk of transmission at home or in other places. To get an 82.5% reduction in total infections, they must have been doing much better than 82.5% reduction in infections at school. For example, if 82.5% of infections in the schools without new ventilation happened at school, you’d need to abolish those at-school infections completely to get 82.5% overall effectiveness. If 90% of infections happened at school, you’d need 92% effectiveness in reducing at-school infections to get 82.5% overall effectiveness.
If the point of the Italian study is just that ventilation is beneficial, it really isn’t major news and it’s not all that helpful to other countries. If the detailed estimates are to be useful, we need to know what they are detailed estimates of.
Q: Did you see a study has found cannabis causes more cancers than tobacco?
A: Sigh. That’s not what it says
Q: Otago Daily Times: Study finds cannabis causes more cancers than tobacco
A: Read a bit further
Q: “shows cannabis is causal in 27 cancers, against 14 cancers for tobacco”. So it’s just saying cannabis is involved in causing more different types of cancer than tobacco? Nothing about more actual cases of cancer.
A: Yes, and if you’re not too fussy about “causes”
Q: Mice?
A: No, people. Well, not people exactly. States. The study had drug-use data averaged over each year in each US state, from a high-quality national survey, and yearly state cancer rates from SEER, which collects cancer data, and correlated one with the other.
Q: Ok, that makes sense. It doesn’t sound ideal, but it might tell us something. So I’m assuming the states with more cannabis use had more cancer, and this was specific to cannabis rather than a general association with drug use?
A: Not quite. They claim the states and years where people used more cannabidiol had higher prostate and ovarian cancer rates — but the states and years where people used more THC had lower rates.
Q: Wait, the drug-use survey asked people about the chemical composition of their weed? That doesn’t sound like a good idea. What were they smoking?
A: No, the chemical composition data came from analyses of illegal drugs seized by police.
Q: Isn’t the concern in the ODT story about legal weed? <reading noises> And in the research paper? Is that going to have the same trends in composition across states
A: Yes. And yes. And likely no.
Q: So their argument is that cannabidiol consumption is going up because of legalisation and prostate cancer is going up and this relationship is causal
A: No, that was sort of their argument in a previous study looking at cancer in kids, which is going up while cannabis use is going up. Here, they argue that ovarian and prostate cancer are going down while cannabidiol use is going down. And that it’s happening in the same states. In this map they say that the states are basically either purple (high cancer and high cannabidiol) or green (low both) rather than red or blue
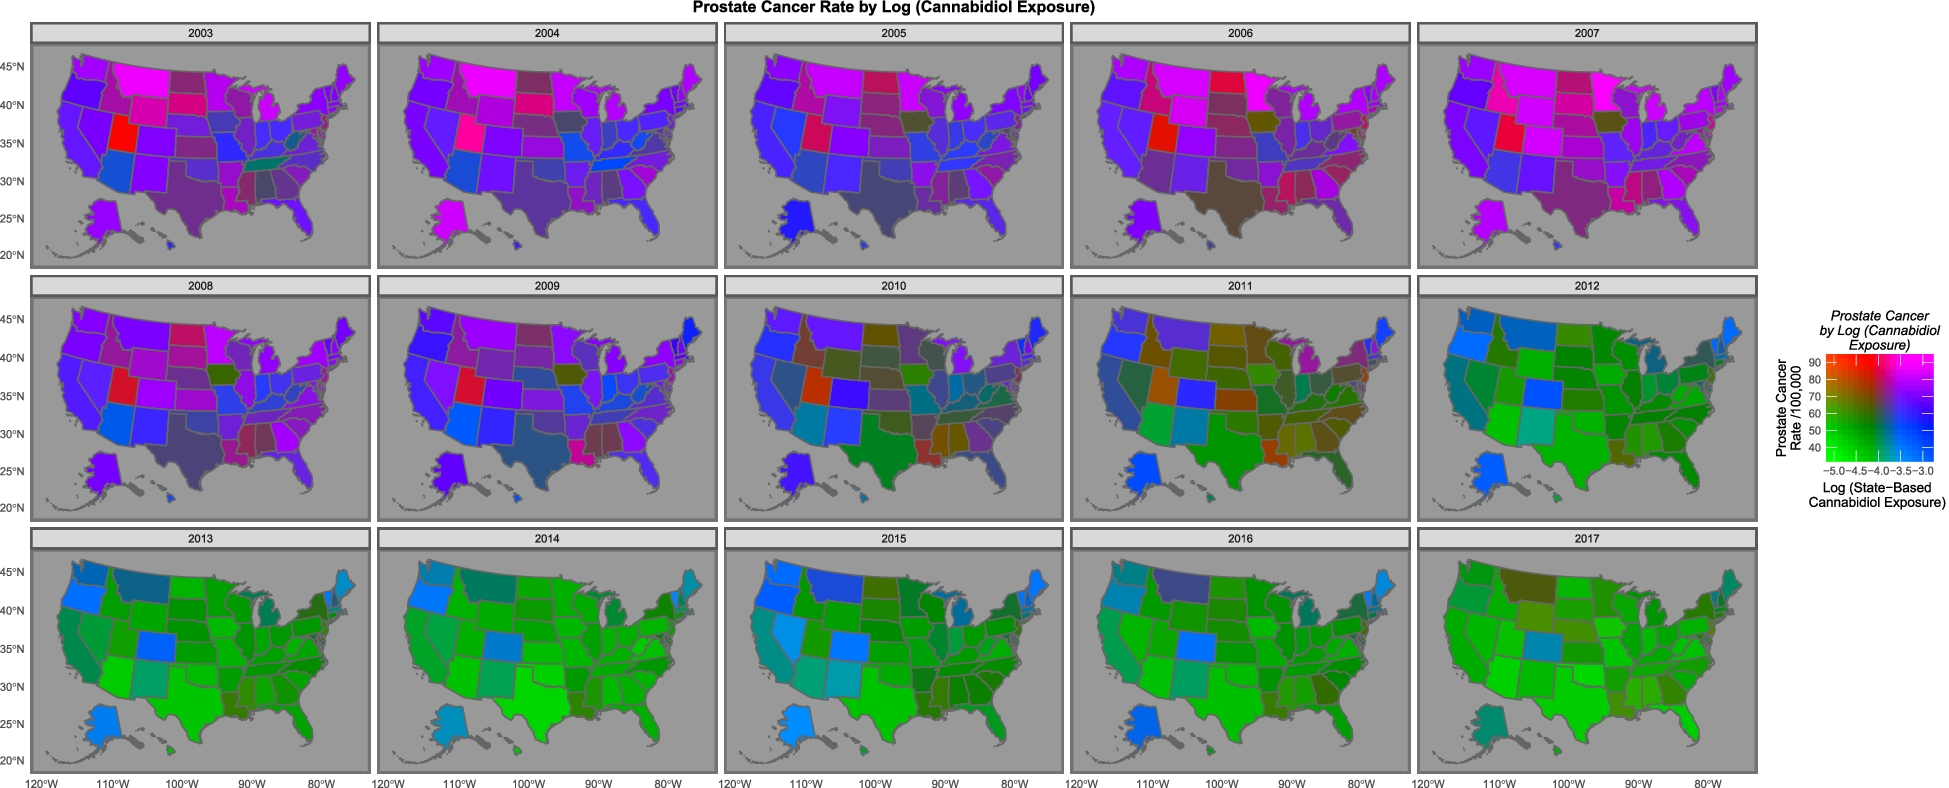
Q: Um.
A: “The purple and pink tones show where both cannabidiol and prostate cancer are high. One notes that as both fall the map changes to green where both are low, with the sole exception of Maine, Vermont and New Hampshire which remain persistently elevated.”
Q: What’s the blue square near the middle, with high weed and low cancer?
A: Colorado, which had one of the early legalisation initiatives.
Q: Isn’t the green:purple thing mostly an overall trend across time rather than a difference between states?
A: That would be my view, too.
Q: How long do they say it takes for cannabis to cause prostate cancer? Would you expect the effect to show up over a period of a few years?
A: It does seem a very short time, but that’s all they could do with their data.
Q: And, um, age? It’s older men who get prostate cancer mostly, but they aren’t the ones you think of as smoking the most weed
A: Yes, the drug-use survey says cannabis use is more common in young adults, a very different age range from the prostate cancer. So if there’s a wave of cancer caused by cannabis legalisation it probably won’t have shown up yet.
Q: Ok, so these E-values that are supposed to show causality. How do they find 20,000,000,000,000,000,000,000,000,000,000,000,000,000,000,000,000,000,000,000,000,000,000,000,000,000,000,000,000,000,000,000,000,000,000,000,000,000,000,000,000,000 times stronger evidence for causality with cannabis, not even using any data on individuals, than people have found with tobacco?
A: It’s not supposed to be strength of evidence, but yes, that’s an implausibly large number. It’s claiming any other confounding variable that explained the relationship would have to have an association that strong with both cancer and cannabidiol. Which is obviously wrong somehow. I mean, we know a lot of the overall decline is driven by changes in prostate screening, and that’s not a two bazillion-fold change in risk.
Q: But how could it be wrong by so much?
A: Looking at the prostate cancer and ovarian cancer code file available with their paper, I think they’ve got the computation wrong, in two ways. First, they’re using the code default of a 1-unit difference in exposure when their polynomial models have transformed the data so the whole range is very much less than one. Second, the models with the very large E-values in prostate cancer and ovarian cancer are models for a predicted cancer rate as a function of percentile (checking for non-linear relationships), rather than models for observed cancer as a function of cannabidiol.
Q: They cite a lot of biological evidence as reasons to believe that cannabinoids could cause cancer.
A: Yes, and for all I know that could be true; it’s not my field. But the associations in these two papers aren’t convincing — and certainly aren’t 1.92×10125-hyper-mega-convincing.
Q: Russell Brown says that the authors are known anti-drug campaigners. But should that make any difference to getting the analysis published? They include their data and code and, you know, Science and Reproducibility and so on?
A: Their political and social views shouldn’t make any difference to getting their analysis published in Archives of Public Health. But it absolutely should make a difference to getting their claims published by the Otago Daily Times without any independent expert comment. There are media stories where the reporter is saying “Here are the facts; you decide”. There are others where the reporter is saying “I’ve seen the evidence, trust me on this”. This isn’t either of those. The reporter isn’t certifying the content and there’s no way for the typical reader to do so; an independent expert is important.
The basic method is described on my Department home page.
Here are the team ratings prior to this week’s games, along with the ratings at the start of the season.
| Current Rating | Rating at Season Start | Difference | |
|---|---|---|---|
| Storm | 17.31 | 19.20 | -1.90 |
| Panthers | 14.72 | 14.26 | 0.50 |
| Rabbitohs | 13.64 | 15.81 | -2.20 |
| Sea Eagles | 8.06 | 10.99 | -2.90 |
| Eels | 4.78 | 2.54 | 2.20 |
| Roosters | 3.20 | 2.23 | 1.00 |
| Sharks | 0.93 | -1.10 | 2.00 |
| Titans | -0.72 | 1.05 | -1.80 |
| Raiders | -2.91 | -1.10 | -1.80 |
| Knights | -4.59 | -6.54 | 2.00 |
| Warriors | -7.93 | -8.99 | 1.10 |
| Dragons | -8.55 | -7.99 | -0.60 |
| Broncos | -9.16 | -8.90 | -0.30 |
| Cowboys | -9.96 | -12.27 | 2.30 |
| Bulldogs | -10.19 | -10.25 | 0.10 |
| Wests Tigers | -10.62 | -10.94 | 0.30 |
So far there have been 32 matches played, 21 of which were correctly predicted, a success rate of 65.6%.
Here are the predictions for last week’s games.
| Game | Date | Score | Prediction | Correct | |
|---|---|---|---|---|---|
| 1 | Titans vs. Wests Tigers | Mar 31 | 8 – 6 | 14.50 | TRUE |
| 2 | Sharks vs. Knights | Apr 01 | 18 – 0 | 7.20 | TRUE |
| 3 | Panthers vs. Rabbitohs | Apr 01 | 26 – 12 | 2.70 | TRUE |
| 4 | Warriors vs. Broncos | Apr 02 | 20 – 6 | 5.70 | TRUE |
| 5 | Sea Eagles vs. Raiders | Apr 02 | 25 – 6 | 13.00 | TRUE |
| 6 | Cowboys vs. Roosters | Apr 02 | 4 – 28 | -8.20 | TRUE |
| 7 | Storm vs. Bulldogs | Apr 03 | 44 – 0 | 28.60 | TRUE |
| 8 | Eels vs. Dragons | Apr 03 | 48 – 14 | 14.00 | TRUE |
Here are the predictions for Round 5. The prediction is my estimated expected points difference with a positive margin being a win to the home team, and a negative margin a win to the away team.
| Game | Date | Winner | Prediction | |
|---|---|---|---|---|
| 1 | Knights vs. Sea Eagles | Apr 07 | Sea Eagles | -9.60 |
| 2 | Warriors vs. Cowboys | Apr 08 | Warriors | 7.50 |
| 3 | Broncos vs. Roosters | Apr 08 | Roosters | -9.40 |
| 4 | Raiders vs. Storm | Apr 09 | Storm | -17.20 |
| 5 | Rabbitohs vs. Dragons | Apr 09 | Rabbitohs | 25.20 |
| 6 | Titans vs. Eels | Apr 09 | Eels | -2.50 |
| 7 | Sharks vs. Wests Tigers | Apr 10 | Sharks | 14.60 |
| 8 | Bulldogs vs. Panthers | Apr 10 | Panthers | -21.90 |
The basic method is described on my Department home page.
Here are the team ratings prior to this week’s games, along with the ratings at the start of the season.
| Current Rating | Rating at Season Start | Difference | |
|---|---|---|---|
| Leinster | 17.18 | 14.79 | 2.40 |
| Munster | 10.28 | 10.69 | -0.40 |
| Ulster | 8.54 | 7.41 | 1.10 |
| Bulls | 6.52 | 3.65 | 2.90 |
| Stormers | 5.64 | 0.00 | 5.60 |
| Edinburgh | 5.05 | 2.90 | 2.20 |
| Sharks | 3.95 | -0.07 | 4.00 |
| Glasgow | 3.38 | 3.69 | -0.30 |
| Connacht | -0.56 | 1.72 | -2.30 |
| Lions | -0.57 | -3.91 | 3.30 |
| Scarlets | -1.33 | -0.77 | -0.60 |
| Ospreys | -2.22 | 0.94 | -3.20 |
| Cardiff Rugby | -4.07 | -0.11 | -4.00 |
| Benetton | -6.38 | -4.50 | -1.90 |
| Dragons | -10.62 | -6.92 | -3.70 |
| Zebre | -18.76 | -13.47 | -5.30 |
So far there have been 112 matches played, 81 of which were correctly predicted, a success rate of 72.3%.
Here are the predictions for last week’s games.
| Game | Date | Score | Prediction | Correct | |
|---|---|---|---|---|---|
| 1 | Sharks vs. Dragons | Apr 02 | 51 – 3 | 18.40 | TRUE |
| 2 | Glasgow vs. Zebre | Apr 02 | 40 – 12 | 28.80 | TRUE |
| 3 | Benetton vs. Connacht | Apr 03 | 17 – 21 | 1.70 | FALSE |
| 4 | Bulls vs. Ulster | Apr 03 | 34 – 16 | 2.90 | TRUE |
| 5 | Lions vs. Edinburgh | Apr 03 | 15 – 9 | -0.20 | FALSE |
| 6 | Stormers vs. Ospreys | Apr 03 | 29 – 13 | 14.00 | TRUE |
| 7 | Munster vs. Leinster | Apr 03 | 19 – 34 | -0.40 | TRUE |
| 8 | Scarlets vs. Cardiff Rugby | Apr 03 | 35 – 20 | 6.10 | TRUE |
Here are the predictions for Week 22. The prediction is my estimated expected points difference with a positive margin being a win to the home team, and a negative margin a win to the away team.
| Game | Date | Winner | Prediction | |
|---|---|---|---|---|
| 1 | Stormers vs. Bulls | Apr 10 | Stormers | 4.10 |
| 2 | Sharks vs. Lions | Apr 10 | Sharks | 9.50 |
| 3 | Cardiff Rugby vs. Scarlets | Apr 10 | Cardiff Rugby | 2.30 |