Ok boomers?
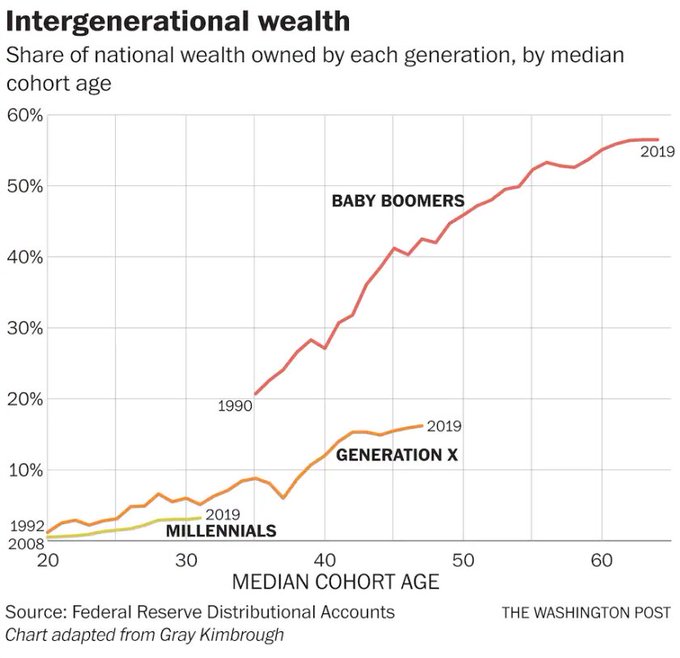
A graph, which has been popular on the internets, in this instance via Matthew Yglesias
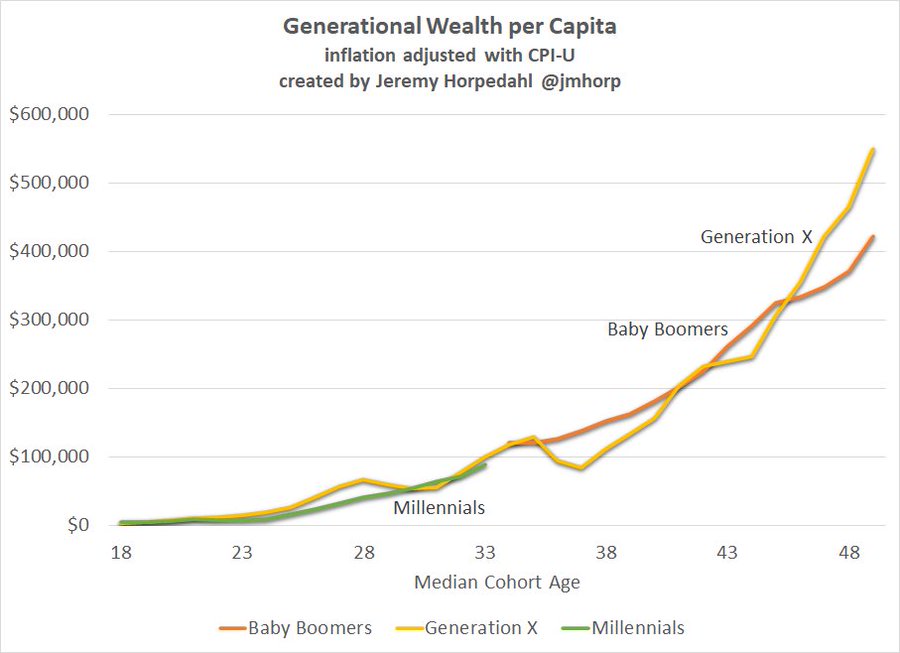
Another graph, showing the same thing per capita rather than as shares of the population, also via Matthew Yglesias. This one appears to have a very different message.
And a third graph, from the FRED system operated by the Federal Reserve Bank, showing US real per-capita GDP
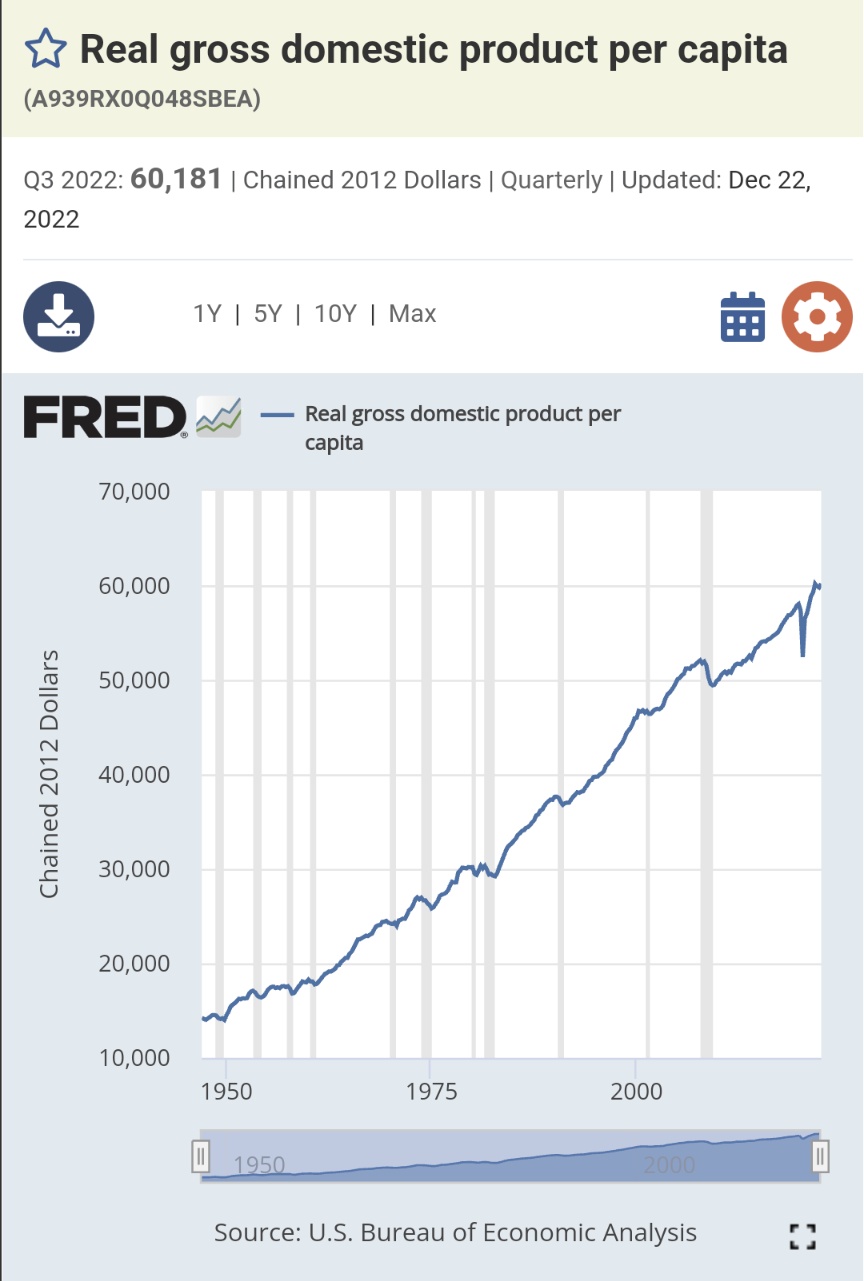
So: Gen X have a much lower share of US wealth than the Baby Boomers did at the same age. This is partly because we are a smaller fraction of the population than they were: per-capita wealth is similar. But per-capita wealth being similar isn’t as good as it sounds, because the US as a whole is substantially richer now than when the Boomers were 50.
This isn’t a gotcha for either of the first two graphs — different questions are allowed to have different answers — but it might be useful context for the comparison
Thomas Lumley (@tslumley) is Professor of Biostatistics at the University of Auckland. His research interests include semiparametric models, survey sampling, statistical computing, foundations of statistics, and whatever methodological problems his medical collaborators come up with. He also blogs at Biased and Inefficient See all posts by Thomas Lumley »