Search results for Q: A: (100)

February 16, 2024

Say the magic word?

Q: Did you see you can be 50% more influential by using this one word!!

A:  Not convinced

Q: But it’s a Harvard study! With Science!

A: How did they measure influentialness?

Q:

A: <eyeroll emoji>

Q: How did they measure influentialness?

A: By whether someone let you in front of them at the photocopier

Q: What’s a photocopier?

A: When we were very young, books and academic journals were published on this stuff called paper, and stored in a special building, and you had to use a special machine to download them, one page at a time, on to your own paper

Q: That must have sucked.  Wait, why are they asking about photocopiers in a study about influencers now?

A: It’s a study from 50 years ago (PDF)

Q: It says 1978, though. That’s nowhere near… fifty…….. Ok, moving right along here. Why is a study from 50 years ago about photocopiers going to be useful now?

A: If it supports the message you just wrote a book about, it might be.

Q: So the study compared different ways of asking if you could use the photocopier?

A: Yes

Q: And the ones where they used the magic word worked better?

A: Not really. They had three versions of the request. Two of them gave a reason and also used the magic word, the third didn’t do either.

Q: But the ones that gave a reason were 50% more influential?

A: In the case where someone was asking for a short use of the photocopier, the success rate was 60% with no reason and over 90% with a reason (and the magic word)

Q: And when it wasn’t short?

A: 24% with no reason, 24% with a bad reason (and the magic word), and 42% with a good reason (and the magic word)

Q: So what really matters is how long you want someone to wait and whether you have a good reason?

A: That would be an interpretation, yes

Q: In 1978

A: Yes

Q: Still, our parents always told use to “say the magic word” when making requests

A: Actually, they didn’t

Q: Well, no, but they might have

A: And the word they were looking for wasn’t “Because”

June 10, 2023

Chocolate for the brain?

Q: Did you see that chocolate and wine really are good for the brain?

A: Not convinced

Q: A randomised trial, though. 16% improvement in memory!

A: A randomised trial, but not 16% improvement in memory

Q: It’s what the Herald says

A: Well, more precisely, it’s what the Daily Telegraph says

Q: What does the research say?

A: It’s a good trial. People were randomly allocated to either flavanols from cocoa or placebo, and they did tests that are supposed to evaluate memory. The scores of both groups improved about 15% over the trial period. The researchers think this is due to practice.

Q: You mean like how Donald Trump remembered the words he was asked in a cognitive function test?

A: Yes, like that.

Q: But the story says there was a benefit in people who had low-flavanol diets before the study.

A: Yes, there was borderline evidence of a difference between people with high and low levels of flavanols in their urine. But that’s a difference of 0.1 points in average score compared to an average change of about 1 point. Nearly all the change in the treated people also showed up in the placebo group, so only a tiny fraction of it could be an effect of treatment.

Q: Was this the planned analysis of the trial or just something they thought up afterwards?

A: It was one of the planned analyses. One of quite a lot of planned analyses.

Q: That’s ok, isn’t it?

A: It’s ok if you don’t get too excited about borderline results in one of the analyses, yes.

Q: So it doesn’t work?

A: It might work — this is relatively impressive as dietary micronutrient evidence goes.  But if it works, it only works for people with low intakes of tea and apples and cherries and citrus and peppers and chocolate and soy.

Q: <sigh> We don’t really qualify, do we?

A: Probably not.

Q: So if we were eating chocolate primarily for the health effects?

A: We’d still be doing it wrong.

July 18, 2022

Sampling and automation

Q: Did you see Elon Musk is trying to buy or maybe not buy Twitter?

A: No, I have been on Mars for the last month, in a cave, with my eyes shut and my fingers in my ears

Q: <poop emoji>.  But the bots? Sampling 100 accounts and no AI?

A: There are two issues here: estimating the number of bots, and removing spam accounts

Q: But don’t you need to know how many there are to remove them?

A: Not at all. You block porn bots and crypto spammers and terfs, right?

Q: Yes?

A: How many?

Q: Basically all the ones I run across.

A: That’s what Twitter does, too. Well, obviously not the same categories.  And they use automation for that.  Their court filing says they suspend over a million accounts a day (paragraph 65)

Q: But the 100 accounts?

A: They also manually inspect about 100 accounts per day, taken from the accounts that they are counting as real people — or as they call us, “monetizable daily active users” — to see if they are bots.  Some perfectly nice accounts are bots — like @pomological or @ThreeBodyBot or @geonet or the currently dormant @tuureiti — but bots aren’t likely to read ads with the same level of interest as monetizable daily active users do, so advertisers care about the difference.

Q: Why not just use AI for estimation, too?

A: One reason is that you need representative samples of bots and non-bots to train the AI, and you need to keep coming up with these samples over time as the bots learn to game the AI

Q: But how can 100 be enough when there are 74.3 bazillion Twitter users?

A: The classic analogy is that you only need to taste a teaspoon of soup to know if it’s salty enough.   Random sampling really works, if you can do it.  In many applications, it’s hard to do: election polls try to take a random sample, but most of the people they sample don’t cooperate.  In this case, Twitter should be able to do a genuine random sample of the accounts they are counting as monetizable daily active users, and taking a small sample allows them to put more effort into each account.  It’s a lot better to look at 100 accounts carefully than to do a half-arsed job on 10,000.

Q: 100, though? Really?

A: 100 per day.  They report the proportion every 90 days, and 9000 is plenty.  They’ll get good estimates of the average even over a couple of weeks


April 7, 2022

Cancer and weed?

Q: Did you see a study has found cannabis causes more cancers than tobacco?

A: Sigh. That’s not what it says

Q: Otago Daily Times: Study finds cannabis causes more cancers than tobacco

A: Read a bit further

Q: “shows cannabis is causal in 27 cancers, against 14 cancers for tobacco”. So it’s just saying cannabis is involved in causing more different types of cancer than tobacco? Nothing about more actual cases of cancer.

A: Yes, and if you’re not too fussy about “causes”

Q: Mice?

A: No, people. Well, not people exactly. States.  The study had drug-use data averaged over each year in each US state, from a high-quality national survey, and yearly state cancer rates from SEER, which collects cancer data, and correlated one with the other.

Q: Ok, that makes sense. It doesn’t sound ideal, but it might tell us something. So I’m assuming the states with more cannabis use had more cancer, and this was specific to cannabis rather than a general association with drug use?

A: Not quite. They claim the states and years where people used more cannabidiol had higher prostate and ovarian cancer rates — but the states and years where people used more THC had lower rates.

Q: Wait, the drug-use survey asked people about the chemical composition of their weed? That doesn’t sound like a good idea. What were they smoking?

A: No, the chemical composition data came from analyses of illegal drugs seized by police.

Q: Isn’t the concern in the ODT story about legal weed? <reading noises> And in the research paper? Is that going to have the same trends in composition across states

A: Yes. And yes. And likely no.

Q: So their argument is that cannabidiol consumption is going up because of legalisation and prostate cancer is going up and this relationship is causal

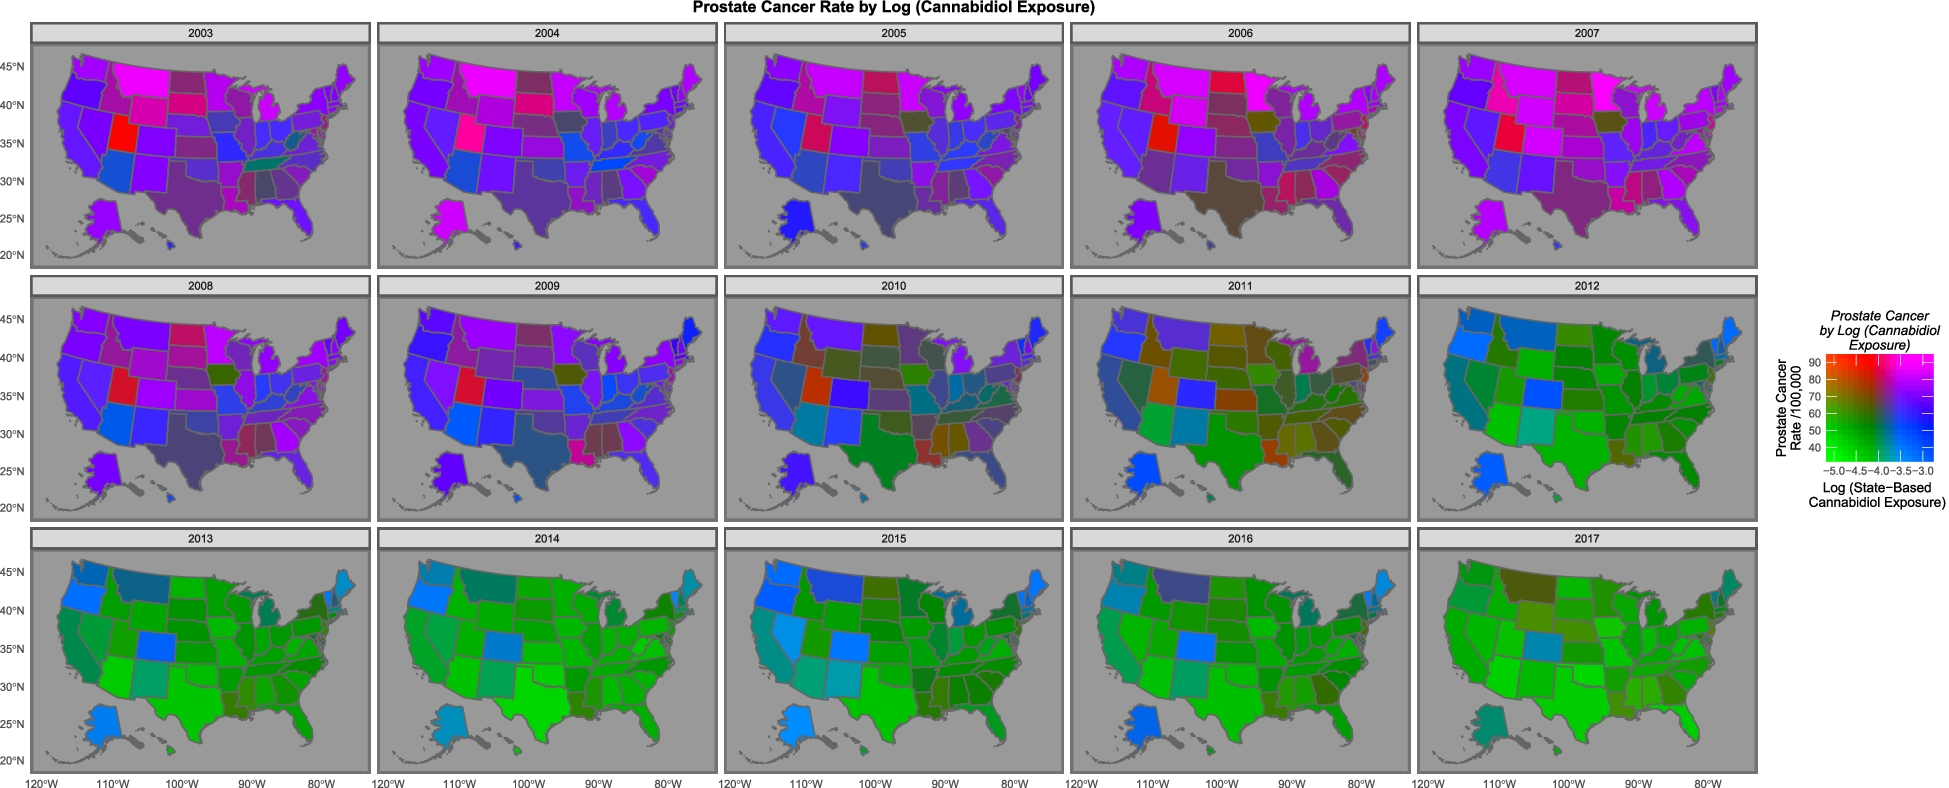
A: No, that was sort of their argument in a previous study looking at cancer in kids, which is going up while cannabis use is going up.  Here, they argue that ovarian and prostate cancer are going down while cannabidiol use is going down.  And that it’s happening in the same states. In this map they say that the states are basically either purple (high cancer and high cannabidiol) or green (low both) rather than red or blue
Q: Um.

A: “The purple and pink tones show where both cannabidiol and prostate cancer are high. One notes that as both fall the map changes to green where both are low, with the sole exception of Maine, Vermont and New Hampshire which remain persistently elevated.”

Q: What’s the blue square near the middle, with high weed and low cancer?

A: Colorado, which had one of the early legalisation initiatives.

Q: Isn’t the green:purple thing mostly an overall trend across time rather than a difference between states?

A: That would be my view, too.

Q: How long do they say it takes for cannabis to cause prostate cancer? Would you expect the effect to show up over a period of a few years?

A: It does seem a very short time, but that’s all they could do with their data.

Q: And, um, age? It’s older men who get prostate cancer mostly, but they aren’t the ones you think of as smoking the most weed

A: Yes, the drug-use survey says cannabis use is more common in young adults, a very different age range from the prostate cancer. So if there’s a wave of cancer caused by cannabis legalisation it probably won’t have shown up yet.

Q: Ok, so these E-values that are supposed to show causality. How do they find 20,000,000,000,000,000,000,000,000,000,000,000,000,000,000,000,000,000,000,000,000,000,000,000,000,000,000,000,000,000,000,000,000,000,000,000,000,000,000,000,000,000 times stronger evidence for causality with cannabis, not even using any data on individuals, than people have found with tobacco?

A: It’s not supposed to be strength of evidence, but yes, that’s an implausibly large number.  It’s claiming any other confounding variable that explained the relationship would have to have an association that strong with both cancer and cannabidiol.  Which is obviously wrong somehow. I mean, we know a lot of the overall decline is driven by changes in prostate screening, and that’s not a two bazillion-fold change in risk.

Q: But how could it be wrong by so much?

A: Looking at the prostate cancer and ovarian cancer code file available with their paper, I think they’ve got the computation wrong, in two ways. First, they’re using the code default of a 1-unit difference in exposure when their polynomial models have transformed the data so the whole range is very much less than one. Second, the models with the very large E-values in prostate cancer and ovarian cancer are models for a predicted cancer rate as a function of percentile (checking for non-linear relationships), rather than models for observed cancer as a function of cannabidiol.

Q: They cite a lot of biological evidence as reasons to believe that cannabinoids could cause cancer.

A: Yes, and for all I know that could be true; it’s not my field. But the associations in these two papers aren’t convincing — and certainly aren’t 1.92×10125-hyper-mega-convincing.

Q:  Russell Brown says that the authors are known anti-drug campaigners. But should that make any difference to getting the analysis published? They include their data and code and, you know, Science and Reproducibility and so on?

A: Their political and social views shouldn’t make any difference to getting their analysis published in Archives of Public Health. But it absolutely should make a difference to getting their claims published by the Otago Daily Times without any independent expert comment.  There are media stories where the reporter is saying “Here are the facts; you decide”. There are others where the reporter is saying “I’ve seen the evidence, trust me on this”. This isn’t either of those. The reporter isn’t certifying the content and there’s no way for the typical reader to do so; an independent expert is important.

 

December 31, 2021

Top non-rugby posts of the year

(The rugby prediction posts, while popular, are most interesting before the games actually happen: predicting the past is relatively easy)

First, the posts, regardless of year of writing, with most 2021 hits

  1.  What’s a Group 1 Carcinogen? (2013) Points out that the IARC classification is not about severity or danger but about the types and amounts of evidence. Sunlight is a Group 1 Carcinogen, so are alcohol and plutonium.
  2. A post about a Lotto strategy that doesn’t work(2012), as an argument about the usefulness of abstract theory. See also, the martingale optional stopping theorem
  3. A climate change post about graphs that shouldn’t have a zero on the y-axis(2015)
  4. From October 2020, but relevant to the news again in March this year, on crime rates in the Cuba/Courtenay area of Wellington and denominators
  5. Actually from July this year, one of the StatsChat Dialogues: Q: Did you see that learning maths can affect your brain? A: Well, yes. There wouldn’t be much point otherwise

And the top 2021-vintage posts

  1. Number 5 from the previous list
  2. From October, on interpreting vaccination percentages
  3. From April, why there’s so much fuss about very rare adverse reactions to vaccines (the AZ blood clots)
  4. From October, why population structure matters to epidemic control, aka, why we need to vaccinate every subgroup. Has pictures!
  5. From June, how a cap-and-trade system for (a subset of) emissions messes up our intuition about other climate interventions.

These are WordPress page views: their relationship to actual readership is complicated; keep in a cool, dry place away from children; may contain nuts.

December 8, 2021

Viagra and Alzheimers

Q: Did you see that Viagra prevents Alzheimer’s?

A: That’s not quite what it says

Q: “Viagra could be used to treat Alzheimer’s disease, study finds”

A: It’s possible that it could be, if it turns out to work

Q: That’s a bit misleading

A: Well, it’s a headline, what do you expect?

Q: Do you want to say that the Guardian covered this better than NewstalkZB?

A: No. Well, whether or not I want to, it’s not true.  The Guardian had the misleading headline and NewstalkZB has an expert saying “As exciting as it may be, it does sound a bit too good to be true though.”

Q: So it’s just mice?

A: No, I don’t think anyone would have had any reason to test this in mice before

Q: Men?

A: Yes. Well, mostly men. Health insurance data on 7.2 million people and 1600 different drugs

Q: How effective is Viagra, then?

A: We don’t know

Q: You know what I mean

A: The people who were prescribed Viagra were 70% less likely to end up with Alzheimer’s

Q: That’s a huge effect!

A: A huge difference. To quote Dr Phil Wood on NewstalkZB “As exciting as it may be, it does sound a bit too good to be true though.”

Q: Whatever. Can you really get a correlation that strong when it’s not a real effect?

A: Finnish research found 2/3 lower rate of dementia in people who regularly used saunas. And in a Swedish study, married men had about half the risk of single or widowed men. And early reports looking at correlations between statin drugs and Alzheimer’s found rates lower by up to 70%. And…

Q: Ok, I get the message. But it could be real?

A: In principle. The researchers give some biological arguments for why it might.  Though given how hard Alzheimer’s is to treat, it would be really surprising if some drug accidentally did way better than anything we’ve ever developed

Q: Maybe there should be a clinical trial?

A: Perhaps. Or at least an observational study in a different population. While it probably won’t work, we wouldn’t want to miss out if it did

August 16, 2021

Seeing like a survey panel

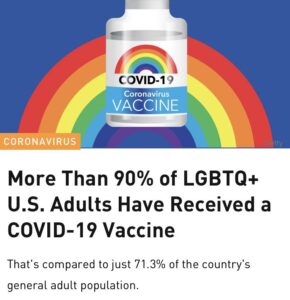
Q: Did you see more than 90% of LGBTQ adults in the US have had the Covid vaccine?

A: How could you even know that?

Q: From Twitter. And! Yahoo! News!

A: But…

Q: It makes sense, right? LGBTQ+ people are less likely to be on the anti-vaccine side of US culture wars, and there’s community experience with health activism

A: But there are queer and trans people in Alabama, not just in San Francisco. And a significant homeless population

Q: But that’s what the survey says

A: Two words: sampling frame

Q: Ok, what’s a sampling frame?

A: It’s the list you work from when you sample people: a list of phone numbers or houses or email addresses or workplaces or whatever. It defines the population you’re going to end up estimating

Q: So they’d just need a list of all the LGBTQ+ people in the US

A:

Q: Ok, yes, that would be scary. How did they really do it?

A: They had a list of some of the LGBTQ+ people in the US (press release, PDF report)

Q: Where did they get the list?

A: “Research participants were recruited through CMI’s proprietary LGBTQ research panel and through our partnerships with over 100 LGBTQ media, events, and organizations.”

Q: That sounds like it might not be very representative

A:  “Because CMI has little control over the sample or response of the widely-distributed LGBTQ Community Survey, we do not profess that the results are representative of the “entire LGBTQ community.””

Q: Exactly.  It might be useful for marketing, but it seems like it’s not going to be representative. They’ll miss some big groups of people

A: “Instead, readers of this report should view results as a market study on LGBTQ community members who interact with LGBTQ media and organizations. CMI views these results as most helpful to readers who want to reach the community through LGBTQ advertising, marketing, events, and sponsorship outreach. Results do not reflect community members who are more closeted or do not interact much with LGBTQ community organizations. More than likely, bisexual community members are also underrepresented in the results.”

Q: When you’re talking in italics like that, does it mean you’re quoting the report?

A: It does. Or the press release

Q: Sounds like they have all the right disclaimers

A: The disclaimers fell off on the way to Yahoo! News! and Twitter, though.

July 4, 2021

Maths

Q: Did you see that learning maths can affect your brain?

A: Well, yes. There wouldn’t be much point otherwise

Q: No, biochemically affect it

A: Yes, that’s how learning works

Q: But the researchers “can actually guess with a very good accuracy whether someone is continuing to study maths or not just based on the concentration of this chemical in their brain.”

A: How good is “very good”?

Q: I thought I was the one who asked those questions.

A:

Q: How good is “very good”?

A: The research paper doesn’t say

Q: Can you get their data?

A: <downloading and analysis noises>

A: Ok, so in their data you can get about 66% accuracy, 55 correct out of 83, using this brain chemical

Q: And just by guessing?

A: 56% (46 out of 83)

Q: Are these changes in the brain good? I mean, apart from learning maths being good for learning maths?

A: That seems to be assumed, but they don’t explain why

Q: And what about subjects other than maths?

A: The Herald piece says the differences they saw with maths don’t happen with any other subject, but the research paper doesn’t say they did the comparisons — in fact, it more or less denies that they did, because it talks about how many comparisons they did just in terms of two brain regions and two chemicals, not in terms of other subjects studied.

Q: But in any case, learning some other subject might still cause different changes in the brain

A: I think we can guarantee that it does, yes

May 21, 2021

But they’re all good dogs

Q: Did you see dogs are better than lateral flow tests for detecting Covid?

A: No

Q: The Guardian says: Dogs can better detect Covid in humans than lateral flow tests, finds study. With 97% accuracy!!

A: That’s the detection rate in people with Covid. The detection rate of Covid in people without Covid is 9%, which is a lot higher than you’d like.

Q: Where did they find the people?

A: It was people turning up to a testing centre in Paris, though since 109 out of 335 had Covid, it can’t really have been representative. The test positivity rate in France as a whole is only 4.5% at the moment and peaked at 15.9%

Q: Is 335 people enough?

A: Potentially, though the study initially planned to get 2000 people

Q: The story says lateral flow tests correctly identify on average 72% of people infected with the virus who have symptoms, and 58% who do not. That sounds really bad. Why does anyone use them?

A:  There’s a lot of variability between tests: some of them are better.  Also, they have much, much lower false positive rates than the dogs — around half a percent.  Since there’s a tradeoff between conservative (giving false negatives) and being sensitive (giving false positives), you can’t just compare the sensitivity of two tests that have a ten-fold difference in false positive rate.

Q: Still dogs would be quicker, and you could just use the real test in people the dogs picked out

A: That has potential, but dogs don’t scale all that well. You need to train and test each dog; they can’t just be mass-produced, boxed up, and mailed around the country.  And dogs aren’t that much quicker — this isn’t walk-past sniffing like the beagles looking for smuggled food at Auckland airport; you need to stick a pad in your armpit for a couple of minutes.

Q: How much of the spin is from the research paper and how much is coming from the newspaper.

A: The researchers are reported in the French source: “Ces résultats confirment scientifiquement la capacité des chiens à détecter une signature olfactive de la Covid-19“, souligne l’AP-HP, précisant que cette étude, pas encore publiée dans une revue médicale, est “la première de ce type réalisée au niveau international“.

Q: J’ai pas de clue que that means

A:  “These results scientifically confirm the ability of dogs to detect an olfactory signature of Covid-19 “, emphasise [the hospital], specifying that this study, not yet published in a medical journal, is ” the first of this type carried out in international level “.

Q: So it’s not just the Guardian

A: No.

April 13, 2021

The problem with journalists?

Q: Did you see that journalists drink too much, are bad at managing emotions, and operate at a lower level than average, according to a new study?

A: That sounds a bit exaggerated

Q: It’s the headlineJournalists drink too much, are bad at managing emotions, and operate at a lower level than average, according to a new study

A: What I said

Q: But “The results showed that journalists’ brains were operating at a lower level than the average population, particularly because of dehydration and the tendency of journalists to self-medicate with alcohol, caffeine, and high-sugar foods.”

A: How did they measure brain dehydration?

Q: Don’t I get to ask the leading questions?

A:

Q: How did they measure brain dehydration?

A: They didn’t. It just means they drank less than 8 glasses of water per day, per the usual recommendations

Q: Aren’t those recommendations basically an urban mythl?

A: Yes, they seem to be

Q: How much caffeine was ‘too much’?

A: More than two cups of coffee per day

Q: Does that cause brain dehydration

A: No, not really

Q: What is the daily recommended limit for coffee anyway?

A: There really isn’t one. The European Food Safety Authority looked at this in 2015, and they said basically that four cups a day seemed pretty safe but they didn’t have a basis for giving an upper limit.

Q: There’s a limit for alcohol, though?

A: Yes, “To keep health risks from alcohol to a low level, the UK Chief Medical Officers (CMOs) advise it is safest not to drink more than 14 units a week on a regular basis.” And the journalists drank slightly more than that on average.

Q: What’s the average for non-journalists?

A: Hard to tell, but the proportion drinking more than 14 units/week is about 1 in 3 for men and about 1 in 6 for women in the UK.

Q: So, a bit higher than average but not much higher.  How about these brain things. How big were the differences?

A: The report doesn’t say — it doesn’t give data, just conclusions

Q: How much evidence is there that they are even real, not just chance?

A: The report doesn’t say, though the Business Insider story says “it is not yet peer reviewed, and the sample size is small, so the results should not be taken necessarily as fact.

Q: When will it be peer-reviewed?

A: Well, the story is from 2017 and there’s nothing on PubMed yet, so I’m not holding my breath.