Posts written by Thomas Lumley (2645)

avatar

Thomas Lumley (@tslumley) is Professor of Biostatistics at the University of Auckland. His research interests include semiparametric models, survey sampling, statistical computing, foundations of statistics, and whatever methodological problems his medical collaborators come up with. He also blogs at Biased and Inefficient

October 27, 2015

Bacon cancer roundup

So now it’s official: processed meat is a IARC Group 1 carcinogen, red meat (including pork) is Group 2A. Their website is a bit slow at the moment, but they have a press release (PDF) and a Q&A (also PDF)

Over the past 24 hours there has been a lot of activity in science communication, trying to offset the early headlines that likened eating processed meat to smoking.

Obviously, the meat industries are also trying to play this down: the difference is we’re saying “look at the actual estimates” and they are saying things like “no published evidence that any single food, including processed meat, caused cancer.”

The International Agency of Research into Cancer (IARC), an arm of the World Health Organization, is notable for two things. First, they’re meant to carefully assess whether things cause cancer, from pesticides to sunlight, and to provide the definitive word on those possible risks.

Second, they are terrible at communicating their findings.

  • Bloomberg has explanations and some nice graphics that move around.
  • The story at Stuff and the new one at the Herald are pretty good, though they both kind of miss the point that people already aren’t eating bacon for the health benefits.
  • 3News is very sensible. One News less so, leading with “putting processed meats in the same danger category as smoking or asbestos, though that doesn’t mean, say, salami is as bad as cigarettes.”
  • Radio NZ is fairly unhelpful in interpreting the IARC ratings, surprisingly so given the high quality of their usual science coverage.
    • Yesterday they had “Meat producers say a report expected to be released today that will suggest bacon, ham and sausages are as big a threat as cigarettes and arsenic will not look at the full picture.
    • Today: “The International Agency for Research on Cancer (IARC), which is part of the WHO and based in Paris, put processed meat like hot dogs and ham in its group 1 list, which already includes tobacco, asbestos and diesel fumes, for which there is “sufficient evidence” of cancer links.”
  • Overseas:
    • The Sydney Morning Herald is good
    • New York Times is excellent; thorough and careful
    • The Guardian is still running the headline “Processed meats rank alongside smoking as cancer causes – WHO” on the front of its site.
    • The Daily Mail“Bacon, burgers and sausages DO cause cancer, says World Health Organsiation as it classifies processed meat as as big a threat as cigarettes
  • Here’s what I said for the Science Media Centre

    The International Agency for Research on Cancer (IARC) has declared processed meat a Group 1 carcinogen and red meat (their definition includes pork) as a Group 2A carcinogen. These are not based on new evidence and are not surprising findings; scientists have believed for a long time that some smoked, salted, or cured meats increase the risk of colorectal cancer and that higher meat consumption probably increases risk to some extent. 

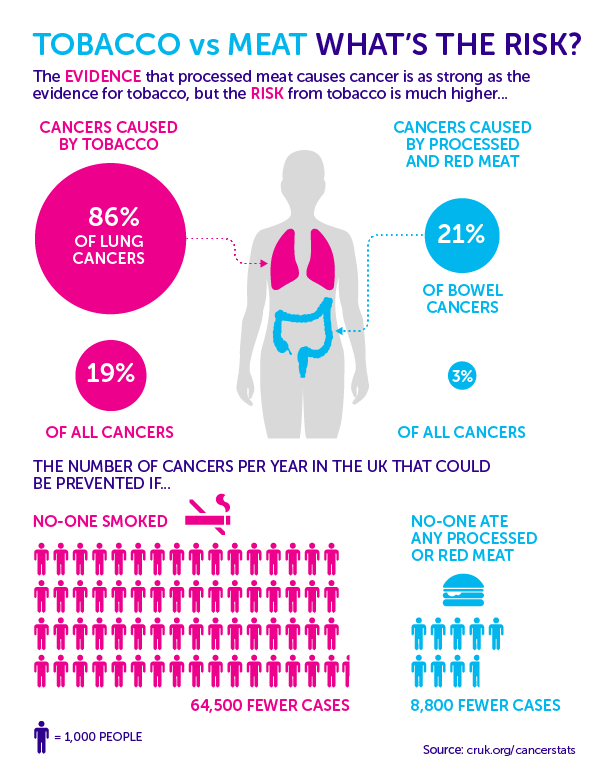
    IARC’s press release confirms that the risk increase (about 1.2 times higher for one daily portion of processed meat) is small from an individual point of view, but that the large number of people who eat meat means that it has a noticeable public health impact. Cancer Research UK estimates that 21% of bowel cancers and 3% of all cancers could be prevented if no-one ate any red meat or processed meat 

    Some of the publicity for the new classification has tried to link the risk of cancer from processed meat to the risk of cancer from other Group 1 carcinogens.  There is no justification for this. IARC classifications are based only on the strength of evidence for an effect at some (not necessarily realistic) dose; they do not consider the size of effect. 

    Group 1 carcinogens are those where IARC believes the cancer hazard is well-established, regardless of its strength. Group 1 includes asbestos, tobacco, and plutonium, but it also includes sunlight, oral contraceptives, and alcohol. 

    The only mention of other Group 1 carcinogens in the new IARC announcement is an explicit disclaimer in their Q&A, saying the classification does NOT mean that they are all equally dangerous. Bringing up other Group 1 carcinogens when explaining the cancer risks of meat consumption does not seem helpful for public understanding.



October 26, 2015

Cheese addiction follow-up

On Friday the Herald published a “cheese addiction” story and I handed out a reading assignment. Now you’ve had the long weekend to look things up, Stuff has come out with the story, so we can look at the warning signs in more detail.

The first hint is in the second sentence

A new study from the US National Library of Medicine..

The US National Library of Medicine is a library, like it says on the tin. It doesn’t conduct or publish research on food addiction any  more than the Auckland City Library wrote or published Into The River.  Unfortunately, the combination of no publisher and no author makes it hard to find the study.

Next we hear about the Yale Food Addiction Scale and foods that rated high

While pizza topped the food list, cheese was also ranked high because of an ingredient called casein, a protein found in all milk products. When it is digested, casein releases opiates called casomorphins. 

If you look up the Yale Food Addiction Scale, you find

Foods most notably identified by YFAS to cause food addiction were those high in fat and high in sugar.

That seems plausible, and it would explain pizza and cheese being on the list.  If the high rating was because of casein, you’d expect high ratings to be given to low-fat cheeses, but not to high-sugar foods, and that isn’t what has been found in the past with this scale.

You probably haven’t heard of casomorphins. I hadn’t. It turns out that quite a lot of small protein fragments stimulate opioid receptors to some extent (in a lab-bench setting). The ones from milk protein are called casomorphins. There are also some from gluten, some from soy protein, and some even from spinach.

So far there isn’t good evidence that any relevant quantity of these fragments would get into the human brain, or that they would have much effect there, but if they did, tofu would be as much a risk as cheese.

While we know the National Library of Medicine didn’t do the research, they do have an excellent search facility for research stored on their virtual shelves.  It doesn’t list any papers about both “Yale Food Addiction Scale” and either “casomorphin” or “casein”.

In any case the story changes right at the end

If a food item is more processed, it’s more likely to be associated with addictive eating behaviours.

If that’s true it would argue against casomorphins being the problem.

Although the full picture does take some work and some knowledge of biochemistry, you can tell in a few minutes with just Wikipedia that the attribution of the research is wrong and that the claims contradict previous uses of the Food Addiction Scale. In Friday’s Herald version you could also tell the story was being pushed by a lobby group rather than by the researchers.

Wealth inequality: not so simple

There’s a new edition of the Credit Suisse report on global wealth. It thinks New Zealand is the second richest nation in the world, and that the USA has 10% of the world’s poorest people.

Here’s a picture of some of those world’s poorest people.

Keck-graduation-2015_0092

These are graduates from the Keck School of Medicine, at the University of Southern California, who owe an average of over US$200,000 in student loans.  By the Credit Suisse definition of wealth inequality they have less wealth than people living in poorly-maintained state housing in south Auckland. They have less wealth than immigrant agricultural workers in southern California. They have less wealth than subsistence farmers in Chad.

The computations are correct in a sense, but useless for two reasons. The first is that they don’t count the value of any non-salable assets (like a degree in medicine from USC, or permanent residency in the US).  The second is more subtle.  Wealth inequality is a concern over and above income inequality mostly because it’s bad for governance: small groups of people get too much power.  Assets minus debts isn’t a good indication of this power, because the cost and effectiveness of lobbying, influence, and bribery varies so much from country to country.


October 24, 2015

Bacon vs cigarettes

There has apparently been a leak from the International Agency for Research on Cancer about their forthcoming assessment of meat. It’s just in the UK papers so far, but I expect it will spread. Here’s an example, from the Telegraph

Bacon, ham and sausages ‘as big a cancer threat as smoking’, WHO to warn
The WHO is expected to publish a report listing processed meat as a cancer-causing substance with the highest of five possible rankings

Presumably what they mean is that IARC is going to classify processed meat as a Group 1 carcinogen. The story is playing on a common misunderstanding of the IARC hazard grades for carcinogenicity.

As I’ve written before, the IARC hazard grades aren’t about the magnitude of the threat. A Group 1 carcinogen is an agent whose ability to cause or promote cancer is well established. To quote the Preamble to the IARC Monographs

A cancer ‘hazard’ is an agent that is capable of causing cancer under some circumstances, while a cancer ‘risk’ is an estimate of the carcinogenic effects expected from exposure to a cancer hazard. The Monographs are an exercise in evaluating cancer hazards, despite the historical presence of the word ‘risks’ in the title. The distinction between hazard and risk is important, and the Monographs identify cancer hazards even when risks are very low at current exposure levels, because new uses or unforeseen exposures could engender risks that are significantly higher.

In the Monographs, an agent is termed ‘carcinogenic’ if it is capable of increasing the incidence of malignant neoplasms, reducing their latency, or increasing their severity or multiplicity.

The ‘five possible rankings‘ mentioned by the Telegraph could also do with some clarification. Effectively, there are three rankings, officially defined as “definite”, “probable”, and “possible”. There’s a “don’t know” ranking for things that haven’t been studied enough to make any assessment. Finally, there’s a largely-hypothetical “probably not” ranking, which has only ever been used once in nearly a thousand assessments.

If the leak is correct, processed meats will be joining alcohol, plutonium, sunlight, tobacco, birth-control pills, and Chinese-style salted fish in Group 1. These aren’t all an equal threat, but the IARC scientists believe all of them are able to cause cancer at the right dose.

Mostly Male Meetings: what are the odds?

A story in the Atlantic talks about an ongoing problem in science (and tech, and science fiction): the large number of conferences where nearly all the high-profile speaking slots go to men.  This isn’t news, even to their readers; there was a story in the Atlantic two and a half years ago on the same point. You don’t see this to quite the same extent in statistics, but at least part of that is because we don’t do as many conferences with a lot of high-profile speaking slots. We tend to let everyone speak.

When this is raised, one of the main negative response (of the ones people are prepared to put their names to), has been that this is chance. That’s what the piece in the Atlantic talks about.

Working with a “conservative” assumption that 24 percent of Ph.D.s in mathematics have been granted to women over the last 25 years, he finds that it’s statistically impossible that a speakers’ lineup including one woman and 19 men could be random.

The  probability of getting 0 or 1 women in a random sample of 20 people from a population with 24% women is 3%.  You could argue that the speakers are likely to be academics, and will tend to be more senior and increase the probability a bit, but the story’s figure of “less than 5%” is not an outlandish estimate — especially as mathematicians make a point of claiming they do their best work young.

On the other hand, 5% (or 3%) isn’t that small a number. It certainly isn’t “statistically impossible” as in the quote or “astronomically small” as in the story’s headline. Considering this conference in isolation the evidence of bias would be positive, but hardly overwhelming.

The statistical aspect of this problem is a bit like the statistical aspect of the Bechdel test for movies (two female characters; who talk to each other; not only about a man). You’d expect some movies to fail the Bechdel test. Some movies should fail the Bechdel test. What’s notable is that about half of all movies do.

You’d expect some conferences to have substantially fewer women than the population average for a field — the women in, say, mathematics will not be spread out evenly, so some topics will have more and some will have fewer in a way that messes up the probability calculation.  Also, some conferences will be more worried about other forms of under-representation — it’s more obvious for women because they are a relatively large fraction of the target population and because you can tell someone’s gender fairly reliably from a name and photo.

There wouldn’t be anything noteworthy about the occasional conference having substantially fewer women than expected. Even with perfect homogeneity across topics and no bias, about one conference in thirty would have a one-in-thirty under-representation of women. In that scenario you could argue there wasn’t any need to do anything about it.

That is so not where we are.

October 23, 2015

A little search goes a long way

The Herald has a story about cheese addiction, meant literally.

To understand why this is probably unreliable, try Wikipedia on the following terms or phrases from the story

Next, consider why Vegetarian Times is the primary source for a story purportedly about biochemistry.

October 22, 2015

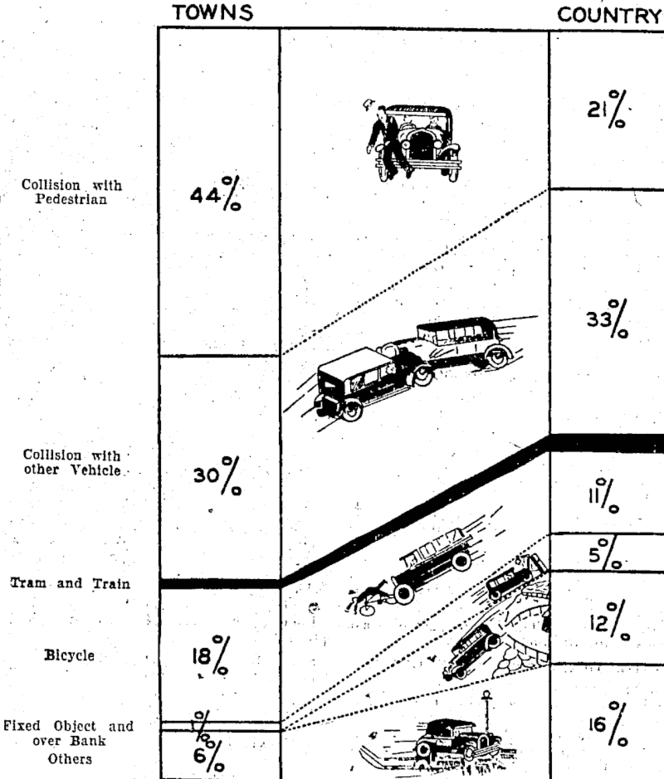
Early NZ data visualisation

From the National Library of New Zealand, via Jolisa Gracewood

natlib.govt

Types of motor-vehicle accidents in rural areas vary considerably from those ocourrlng In urban areas, as shown in tho above chart. Tho percentages are based on figures of the Transport Department in respect of accidents causing’ fatalltles during the twelve months, April I, 1932, to March 31, 1933.

The text goes on to say “The black section representing collisions with tram and train forms only I per cent, of the whole, through this type of accident appeals to the popular Imagination’ from its spectacular nature.”  Some things don’t change.

Second-hand bogus poll

Headline1 in 3 women watch porn – survey

Opening sentence: One in three young women regularly view porn, with many watching it on their smartphone, it has emerged.

It turns out this is “Some 31 per cent of participants in the survey by magazine Marie Claire.” If you Google, you can find the Marie Claire invitation to take the survey, with a link. There are also Facebook and YouTube versions of the invitation. It’s a self-selected internet survey; a bogus poll.

Considered in the context of its original purpose, this survey isn’t so bad. It’s part of a major project(possibly NSFW) by the magazine, and its contributing editor Amanda de Cadenet, to discuss women’s use of pornography.  The survey provided a way for them to involve readers, and a context for telling readers, however they responded, “there are lots of other women like you”.  From that point of view the quantitative unreliability and poorly-defined target population isn’t such a problem, though it would presumably be better to have the right numbers.

Disconnected from the magazine and presented as data-based news, the survey results have very little going for them.

The wine when it is red

Q: Are you going to have a glass of wine tonight?

A: You mean as a celebration?.

Q: No, because a glass of red wine has the same benefits as a gym session. The Herald story?

A: Yeah, nah.

Q: What part of “Red wine equal to a gym workout – study” don’t you understand?

A: How they got that from the research.

Q: Was this just correlations again?

A: No, it was a real experimental study.

Q: So I’m guessing you’re going to say “in mice”?

A: Effectively. It was in rats.

Q: They gave some rats red wine and made others do gym workouts?

A: No, there wasn’t any red wine.

Q: But the story… ah, I see. “A compound found in red wine”. They gave the rats this compound directly?

A: That’s right

Q: And the gym workouts?

A: Basically, yes. The rats did treadmill runs, though they don’t report that they had headphones on at the time.

Q: So the resveratrol group ended up fitter than the exercise group?

A: No, both groups got the workouts. The resveratrol plus exercise group ended up fitter than the group just getting exercise.

Q: So, really, it’s about a glass of red wine plus a gym workout, not instead of a gym workout? If it was people, not rats?

A: Well, not “a glass”.

Q: How many glasses?

A: The rats got 146mg resveratrol per kg of weight per day. One standard conversion rate is to divide by 7 to get mg/kg in humans: about 20. So for a 60kg person, that’s about 1200mg/day of resveratrol.

Q: How much is in a glass of wine?

A: It depends on the size, but at 5 glasses per bottle, maybe 0.3 mg

Q: So we might need bigger glasses, then.

A: At least you’ll get plenty of exercise lifting them.

October 20, 2015

World Statistics Day

[this post by Julie Middleton]

WSD_Logo_Final_Languages_Outline

Today is World Statistics Day, and statisticians all over the world will be showcasing the value of their work under the theme ‘Better data, better lives’.
To mark the day, Statistics New Zealand is putting out three useful resources:[

1: An animated infographic that expresses the value of statistics to the economy and people as they go about their day-to-day lives;

2: A video that summarises in two minutes changes in New Zealand’s population over the last 150 years;

3: A video that summarises the highs and lows of 30 years of labour market statistics.

World Statistics Day was proclaimed by the United Nations General Assembly in 2010 to recognise the importance of statistics in shaping our societies. National and regional statistical days already existed in more than 100 countries, but the General Assembly’s adoption of this international day as 20 October brought extra momentum. That first World Statistics Day in October 2010 was marked in more than 130 countries and areas.

According to UNStats, this year marks an important cornerstone for official statistics, with the conclusion of the Millennium Development Goals (see how countries have fared here), the post-2015 development agenda, the data revolution (see what the Data Revolution Group set up by UN Secretary-General Ban Ki-Moon has to say here), the preparations for the 2020 World Population and Housing Census Programme and the likes.
One cute initiative of UNStats is to translate the English logo for World Statistics Day into many of the languages of the world. We couldn’t miss the opportunity to have UNStats do one in the first language of this country, te reo Māori. Te tino kē hoki o te moko nā! (Nice logo!)

WorldStatsDay_Logo_Maori-01
You can download logos in English, Māori and dozens of other languages from the UNStats site here.

One important initiative of the UN for this year’s commemoration is the launch, at its New York headquarters, of the report The World’s Women 2015: Trends and Statistics. The report is produced every five years under the Beijing Platform for Action, which was adopted at the Fourth World Conference on Women in 1995.

The eight chapters of the report cover several critical areas of policy concerns identified in that landmark 1995 conference: population and families; health; education; work; power and decision-making; violence against women; environment; and poverty. It takes a life-cycle approach in revealing the experiences of women and men during different periods of life.