Posts written by Thomas Lumley (2645)

avatar

Thomas Lumley (@tslumley) is Professor of Biostatistics at the University of Auckland. His research interests include semiparametric models, survey sampling, statistical computing, foundations of statistics, and whatever methodological problems his medical collaborators come up with. He also blogs at Biased and Inefficient

June 3, 2015

Cancer correlation and causation

It’s a change to have a nice simple correlation vs causation problem. The Herald (from the Telegraph) says

Statins could cut the risk of dying from cancer by up to half, large-scale research suggests. A series of studies of almost 150,000 people found that those taking the cheap cholesterol-lowering drugs were far more likely to survive the disease.

Looking at the conference abstracts,  a big study found a hazard ratio of 0.78 based on about 3000 cancer deaths in women and a smaller study found a hazard ratio of 0.57 based on about half that many prostate cancer deaths (in men, obviously). That does sound impressive, but it is just a correlation. The men in the prostate cancer studies who happened to be taking statins were less likely to die of cancer; the women in the Women’s Health Initiative studies who happened to be taking statins were less likely to die of cancer.

There’s a definite irony that the results come from the Women’s Health Initiative. The WHI, one of the most expensive trials ever conducted, was set up to find out if hormone supplementation in post-menopausal women reduced the risk of serious chronic disease. Observational studies, comparing women who happened to be taking hormones with those who happened not to be, had found strong associations. In one landmark paper, women taking estrogen had almost half the rate of heart attack as those not taking estrogen, and a 22% lower rate of death from cardiovascular causes. As you probably remember, the WHI randomised trials showed no protective effect — in fact, a small increase in risk.

It’s encouraging that the WHI data show the same lack of association with getting cancer that summaries of randomised trials have shown, and that there’s enough data the association is unlikely to be a chance finding. As with estrogen and heart attack there are biochemical reasons why statins could increase survival in cancer. It could be true, but this isn’t convincing evidence.

Maybe someone should do a randomised trial.
Expensive new cancer drugs

From Stuff:

Revolutionary new drugs that could cure terminal cancer should be on the market here within a few years but patients will have to be “super rich” to afford them.

One four-dose treatment of the drug now under clinical trials costs about $140,000 while other ongoing courses can cost hundreds of thousands of dollars

That’s one real possibility, but there are others.

Firstly, the new drugs might not be all that good. After all, we had some of the same enthusiasm about angiogenesis inhibitors in the late 1990s and about selective tyrosine kinase inhibitors a few years later. The new immunotherapies look wonderful, but so far only  for a minority of patients. And we’re seeing their best side now, from trials stopped early for efficacy.

Alternatively, they might be too effective.  The adaptive immune system is kept under the same sort of strict controls as nuclear weapons, and for much the same reason — its ability to turn the battlefield into a lifeless wasteland. The most successful new treatments remove one of the safety checkpoints, and it’s possible that researchers won’t be able to dramatically expand the range of patients treated without producing dangerous collateral damage.

Finally, there’s the happy possibility. If we get evidence that inhibiting PD-1 and other T-cell checkpoints is safe and broadly effective, everyone will want to make inhibitors, and we’ll get competition. Bristol-Myers-Squib has a monopoly on nivolumab, but it doesn’t have a monopoly on immune checkpoint inhibition. This is already happening, as Bruce Booth reports from the ASCO conference

Most major oncology players have abstracts involving PD-1, including Merck, BMS, AZ, Novartis, Roche, and pretty much everyone else.  Other T-cell related targets like CTLA-4, TIM-3, OX-40, and LAG-3 round out the list of frequent mentions

The drugs still won’t be cheap, because each company will need its own clinical trials, but the development risk will be much lower and the margin for rapacious price-gouging narrower, so they won’t be $140000 per patient for very long.

June 2, 2015

Improving pie-charts

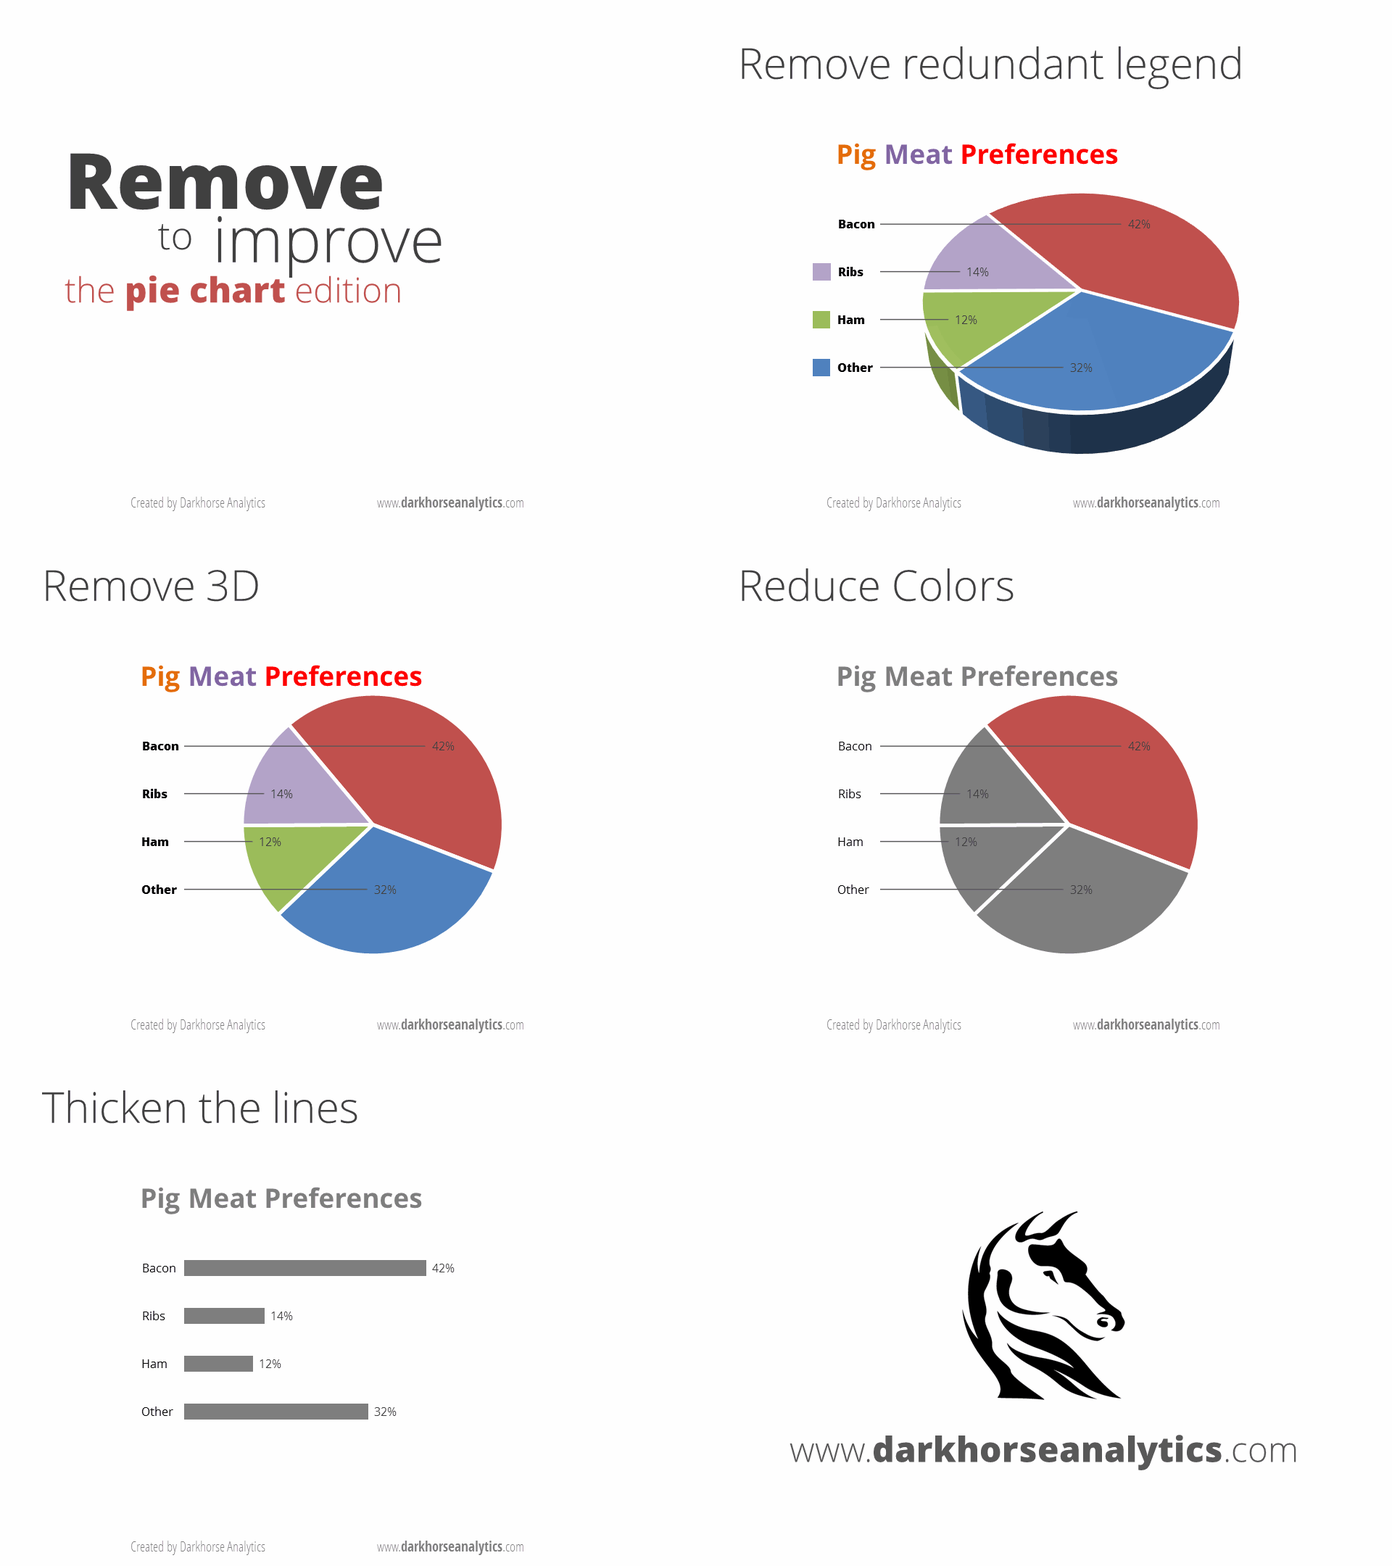
We’ve seen animations of this sort from Darkhorse Analytics before, but this one is special. It shows how to remove unnecessary components from a pie chart to produce something genuinely useful, though, sadly, the procedure doesn’t work for all pie charts.

Click on the picture to start the animation

devourThePie3

(via @JennyBryan)

June 1, 2015

Graph of the week

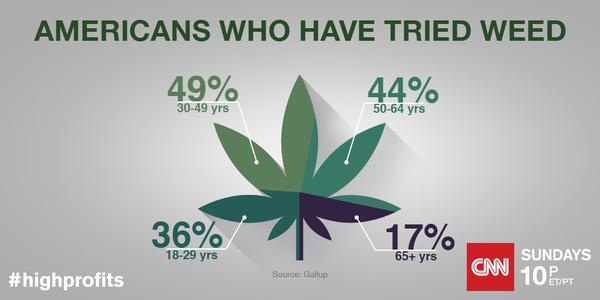
Yes, it’s only Monday, but this one will be hard to beat (from CNN on Twitter, via @albertocairo)

CGX6SisW8AA_QOQ

The off-square dividing make this look as if it’s trying to be a pie chart, but it isn’t. Not only are these not percentages of the same thing and so make no sense as a pie, the colour sections aren’t even scaled in proportion to the numbers (whether you look at angle or area).

May 31, 2015

Of droughts and flooding rains

Australia’s climate is weird, even in the relatively habitable bits such as Melbourne, so it makes for interesting graphs. This is going to be another post about aspect ratios and alignment in graphs and how to use them for things other than lying with statistics. (more…)

May 30, 2015

Briefly

  • Michael LaCour, the researcher accused of faking data in his study on changing opinions about same-sex marriage, has issued a response to the allegations today as he promised. Virginia Hughes at Buzzfeed and  Ivan Oransky at RetractionWatch have stories. I’ve seen a lot of comments about this on Twitter from people who work in empirical social sciences or in ethics. So far I haven’t seen anyone who is convinced by the response.
  • There’s story in New York magazine about David Broockman, who found the problems, about the difficulty of reporting suspicions of fraud in research.  ““I think there’s an interesting metaphor between what I went through now and what I went through as a gay teenager,” Broockman says.
  • The UK is introducing a ‘legal highs’ ban. The government are using a widelyquoted figure of 97 deaths in the last year due to legal highs.  As Vice.com explains, the figure is bogus in two ways. Firstly, the figure is based on detectable presence of a drug, not on it being even a contributing cause. Secondly and more importantly, the drugs in the majority of these cases were already illegal at the time.
  • You’ve probably seen the Washington Post chart of deaths in World Cup construction. Unless you saw it at the original site, you may not have seen the disclaimer above it (emphasis added):

Some of these numbers (like Sochi’s) are third-party estimates, others (like Beijing’s) are based on official numbers that are almost certainly an undercount. And it’s tough to do an apples-to-apples comparison here, since the Qatar estimates include the deaths of all migrant workers after the announcement of Qatar’s successful bid in 2010, while other countries’ figures may only include deaths directly related to, say, stadium construction.

The exploitation of migrant workers isn’t new and it isn’t all Sepp Blatter’s fault. It’s one of the reasons Qatar was regarded as a terrible choice at the time.
Social media tends to spread images out of context, and this can be a problem if you’re trying to be seen as the sort of journalist who cares about facts.

Coffee health limit exaggerated

The Herald says

Drinking the caffeine equivalent of more than four espressos a day is harmful to health, especially for minors and pregnant women, the European Union food safety agency has said.

“It is the first time that the risks from caffeine from all dietary sources have been assessed at EU level,” the EFSA said, recommending that an adult’s daily caffeine intake remain below 400mg a day.

Deciding a recommended limit was a request of the European Commission, the EU’s executive body, to try to find a Europe-wide benchmark for caffeine consumption.

But regulators said the most worrying aspect was not the espressos and lattes consumed on cafe terraces across Europe, but Red Bull-style energy drinks, hugely popular with the young.

Contrast that with the Scientific Opinion on the safety of caffeine from the EFSA Panel on Dietetic Products, Nutrition, and Allergies (PDF of the whole thing). First, what they were asked for

the EFSA Panel … was asked to deliver a scientific opinion on the safety of caffeine. Advice should be provided on a daily intake of caffeine, from all sources, that does not give rise to concerns about harmful effects to health for the general population and for specific subgroups of the population. Possible interactions between caffeine and other constituents of so-called “energy drinks”, alcohol, synephrine and physical exercise should also be addressed.

and what they concluded (there’s more than 100 pages extra detail if you want it)

Single doses of caffeine up to 200 mg, corresponding to about 3 mg/kg bw for a 70-kg adult are unlikely to induce clinically relevant changes in blood pressure, myocardial blood flow, hydration status or body temperature, to  reduce perceived extertion/effort during exercise or to mask the subjective perception of alcohol intoxication. Daily caffeine intakes from all sources up to 400 mg per day do not raise safety concerns for adults in the general population, except pregnant women. Other common constituents of “energy drinks” (i.e. taurine, D-glucurono-γ- lactone) or alcohol are unlikely to adversely interact with caffeine. The short- and long-term effects of co-consumption of caffeine and synephrine on the cardiovascular system have not been adequately investigated in humans. Daily caffeine intakes from all sources up to 200 mg per day by pregnant women do not raise safety concerns for the fetus. For children and adolescents, the information available is insufficient to base a safe level of caffeine intake. The Panel considers that caffeine intakes of no concern derived for acute consumption in adults (3 mg/kg bw per day) may serve as a basis to derive daily caffeine intakes of no concern for children and adolescents.

Or, in even shorter paraphrase.

<shrugs> If you need a safe level, four cups a day seems pretty harmless in healthy people, and there doesn’t seem to be a special reason to worry about teenagers.


May 28, 2015

Junk food science

In an interesting sting on the world of science journalism, John Bohannon and two colleagues, plus a German medical doctor, ran a small randomised experiment on the effects of chocolate consumption, and found better weight loss in those given chocolate. The experiment was real and the measurements were real, but the medical journal  was the sort that published their paper two weeks after submission, with no changes.

Here’s a dirty little science secret: If you measure a large number of things about a small number of people, you are almost guaranteed to get a “statistically significant” result. Our study included 18 different measurements—weight, cholesterol, sodium, blood protein levels, sleep quality, well-being, etc.—from 15 people. (One subject was dropped.) That study design is a recipe for false positives.

Think of the measurements as lottery tickets. Each one has a small chance of paying off in the form of a “significant” result that we can spin a story around and sell to the media. The more tickets you buy, the more likely you are to win. We didn’t know exactly what would pan out—the headline could have been that chocolate improves sleep or lowers blood pressure—but we knew our chances of getting at least one “statistically significant” result were pretty good.

Bohannon and his conspirators were doing this deliberately, but lots of people do it accidentally. Their study was (deliberately) crappier than average, but since the journalists didn’t ask, that didn’t matter. You should go read the whole thing.

Finally, two answers for obvious concerns: first, the participants were told the research was for a documentary on dieting, not that it was in any sense real scientific research. Second: no, neither Stuff nor the Herald fell for it.

 [Update: Although there was participant consent, there wasn’t ethics committee review. An ethics committee probably wouldn’t have allowed it. Hilda Bastian on Twitter]

Road deaths up (maybe)

In Australia road deaths are going down but in New Zealand the number has shot up“, says the Herald, giving depressing-looking international comparisons from newly-announced OECD data. The percentage increase was highest in New Zealand The story does go on to point out that the increase reverses a decrease the previous year, suggesting that it might be that 2013 was especially good, and says

An ITF spokesman said New Zealand’s relatively small size made percentage movements more dramatic.”

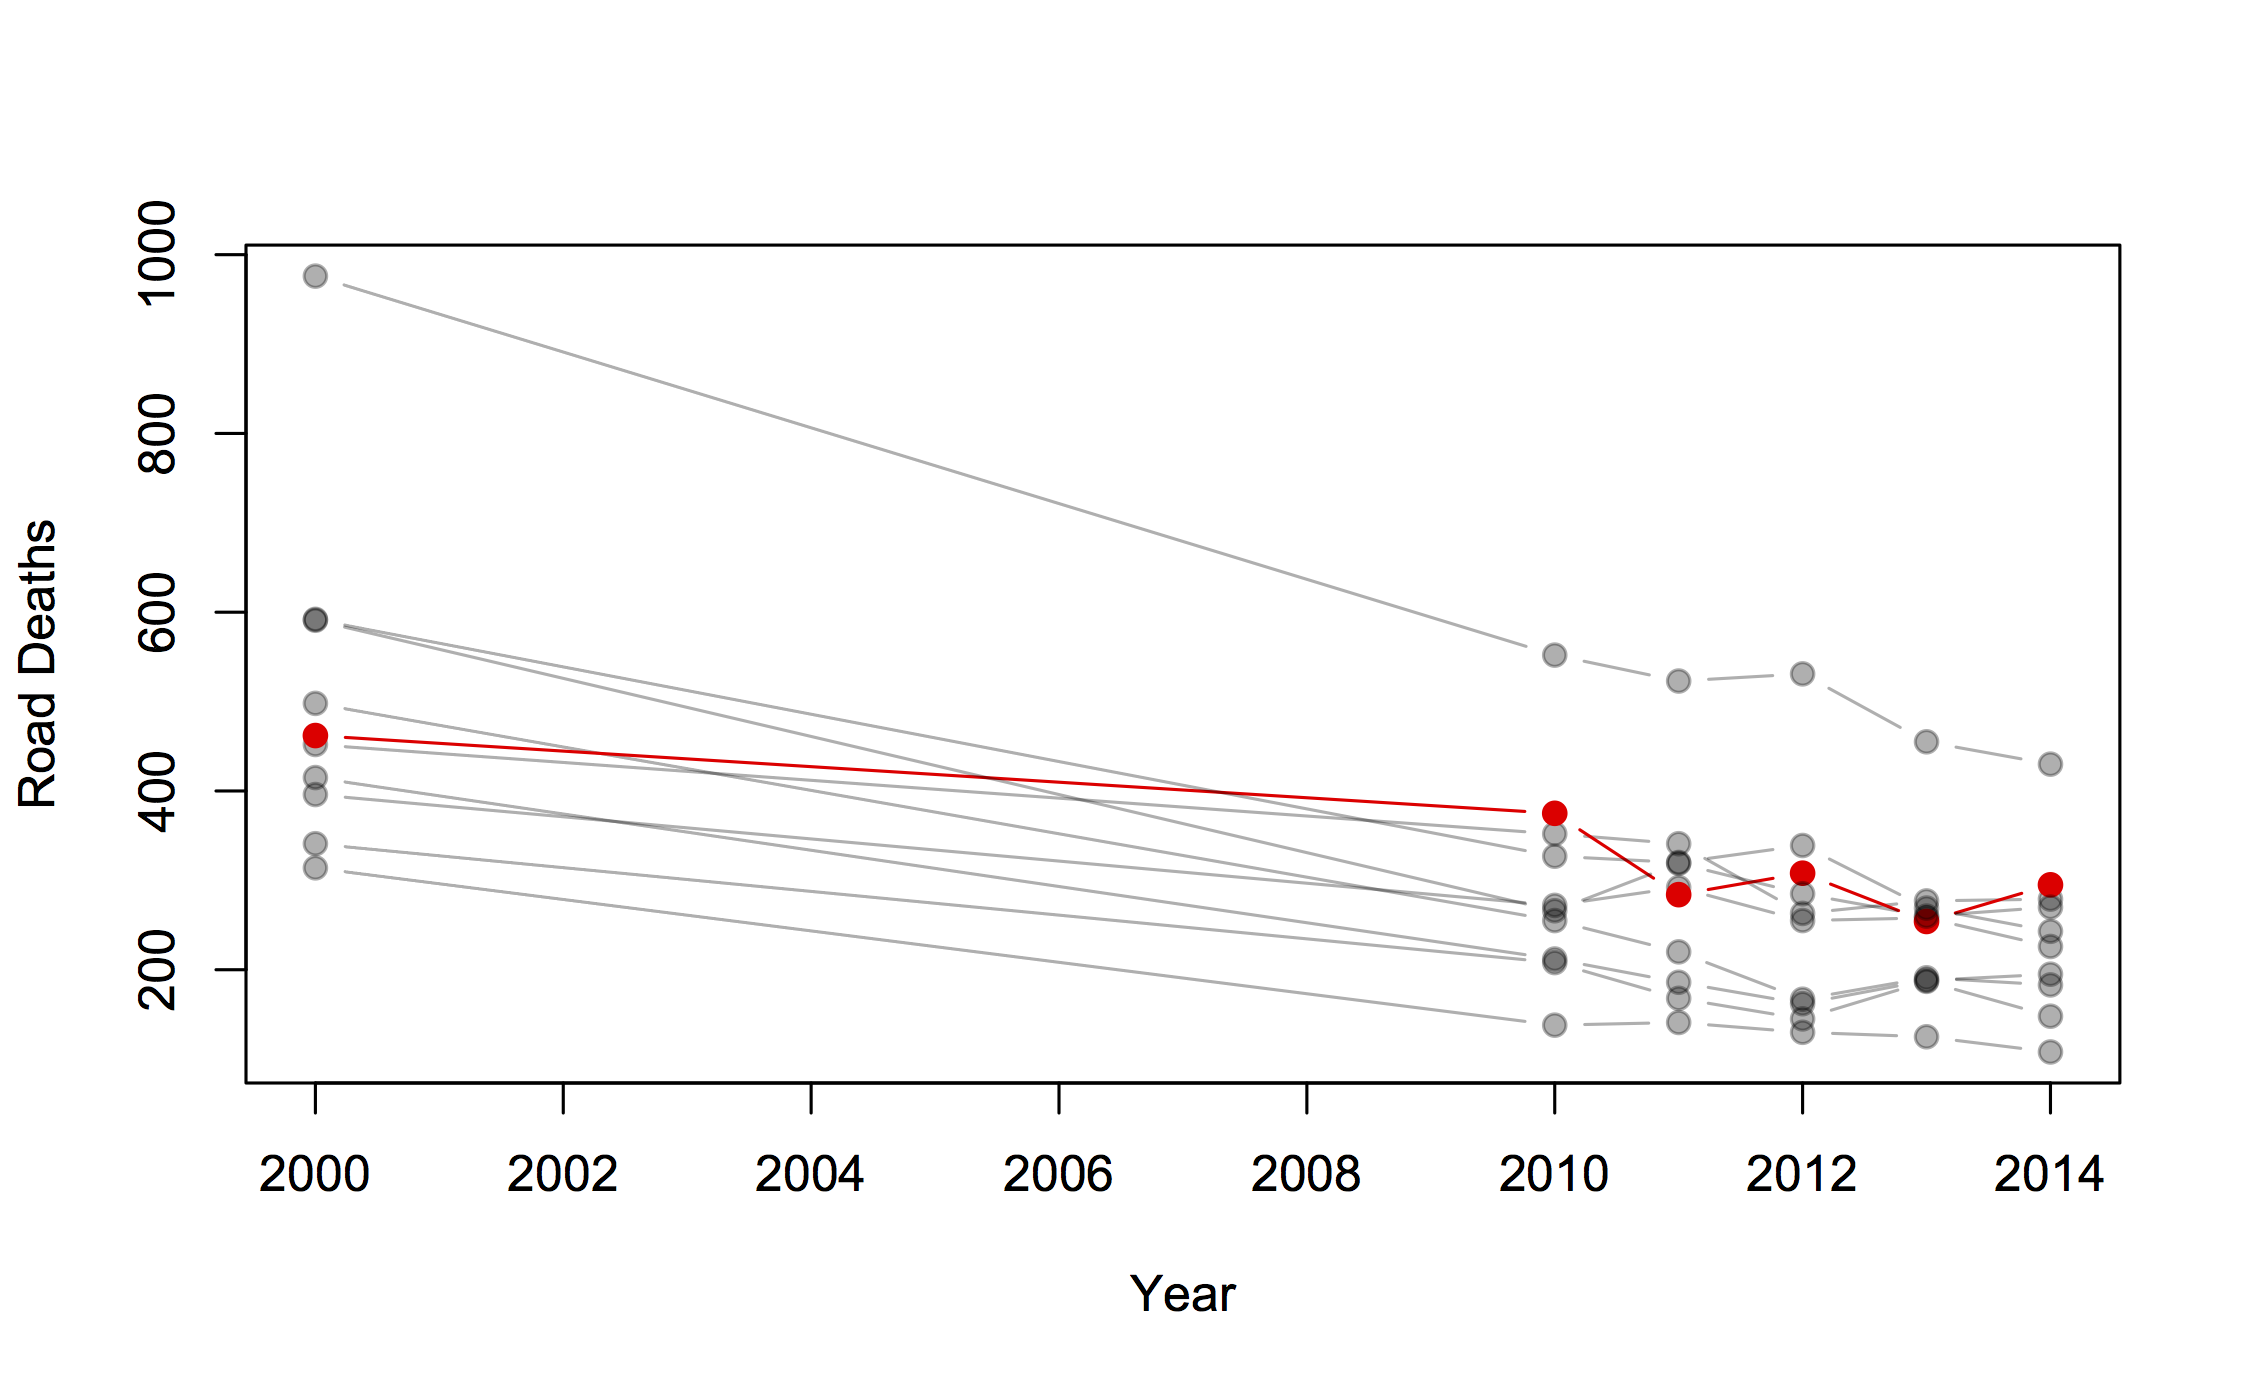
Overall, it’s a good piece. Two things I want to add: first, it’s almost always useful to see more context in a time series if it’s available. I took the International Road Traffic Accident Database and picked out a group of countries with similar road toll to New Zealand in 2000: all those between 200 and 1000. The list is Austria, Denmark, Finland, Ireland, Israel, New Zealand, Norway, Slovenia, Sweden, Switzerland. Here are the data for 2000 and for 2010-2014; New Zealand is in red.

roaddeaths

There’s a general downward trend, but quite a bit of bouncing around due to random variation. As we keep pointing out, there are lots of mistakes made when driving, and it takes bad luck to make one of these fatal, so there is a lot of chance involved. It’s clear from the graph that the increase is not much larger than random variation.

Calculations using the Poisson distribution (the simplest reasonable mathematical model, and the one with the smallest random variation) are, likewise, borderline. There’s only weak evidence that road risk was higher last year than in 2013. The right reference level, though, isn’t ‘no change’, it’s the sort of decrease that other countries are seeing.  The median change in this group of 10 countries was a 5% decrease, and there’s pretty good evidence that New Zealand’s risk did not decrease 5%.  Also, the increase is still present this year, making it more convincing.

What we can’t really do is explain why. As the Herald story says, some of the international decrease is economic: driving costs money, so people do less of it in recessions. Since New Zealand was less badly hit by recession, you’d expect less decrease in driving here, and so less decrease in road deaths. Maybe.

One thing we do know: while it’s tempting and would be poetic justice, it’s not valid to use the increase as evidence that recent road-safety rule changes have been ineffective. That would be just as dishonest as the claims for visible success of the speed tolerance rules in the past.


May 27, 2015

We like to drive in convoys

This isn’t precisely statistics, more applied probability, but that still counts.  First, an interactive from Lewis Lehe, a PhD student in Transport Engineering at UC Berkeley. It shows why buses always clump together.

busclump

You might also like his simulations of bottlenecks/gridlock and of congestion waves in traffic (via @flowingdata)


And second, a video from the New York subway system. When a train gets delayed, it holds up all the trains behind it. More surprisingly, the system is set up to delay the train in front of it, to keep the maximum gap between trains smaller.