Posts written by Thomas Lumley (2645)

avatar

Thomas Lumley (@tslumley) is Professor of Biostatistics at the University of Auckland. His research interests include semiparametric models, survey sampling, statistical computing, foundations of statistics, and whatever methodological problems his medical collaborators come up with. He also blogs at Biased and Inefficient

November 5, 2014

Briefly

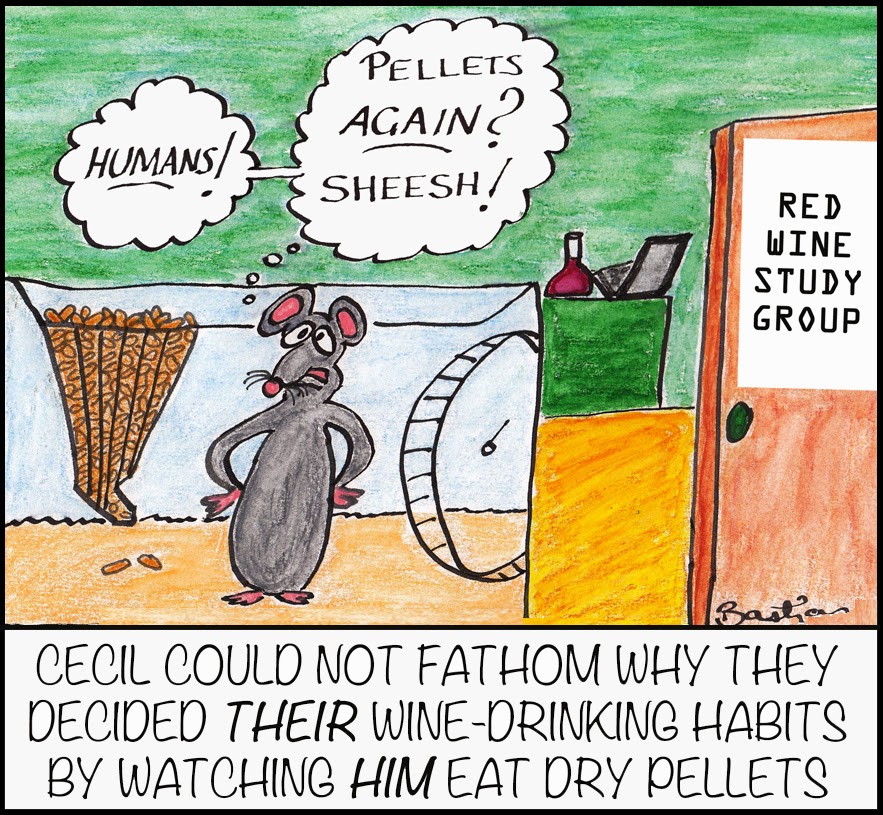
Humans-sheesh

US election graphics

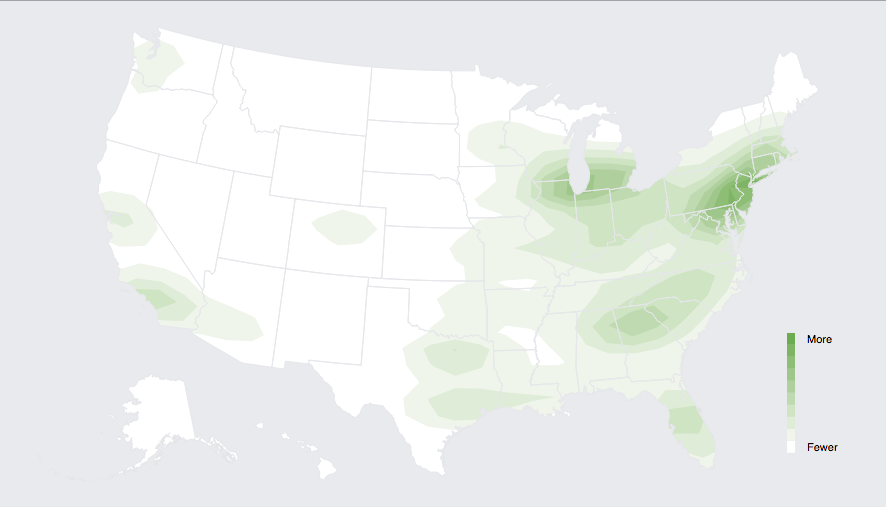
Facebook has a live map of who has mentioned on Facebook that they had voted (via Jason Sundram)

facebook-voted

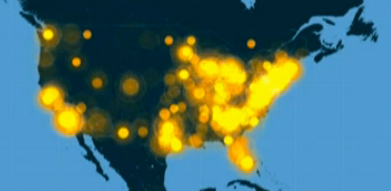
USA Today showed a video including a Twitter live map

twitter-elections

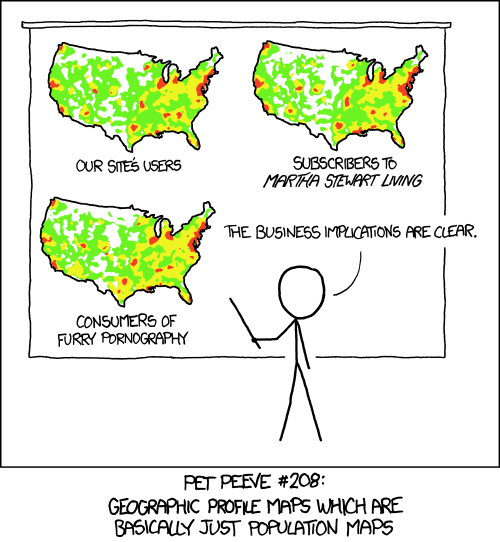
These both have the usual problem with maps of how many people do something: there are more people in some places than others. As usual, XKCD puts it well:

xkcd-elections

Useful statistics is about comparisons, and this comparison basically shows that more people live in New York than in New Underwood.

As usual, the New York Times has informative graphics, including a live set of projections for the interesting seats.


November 3, 2014

It’s warmer out there

Following a discussion on Twitter this morning, I thought I’d write again about increasing global temperatures, and also about the types of probability statements.

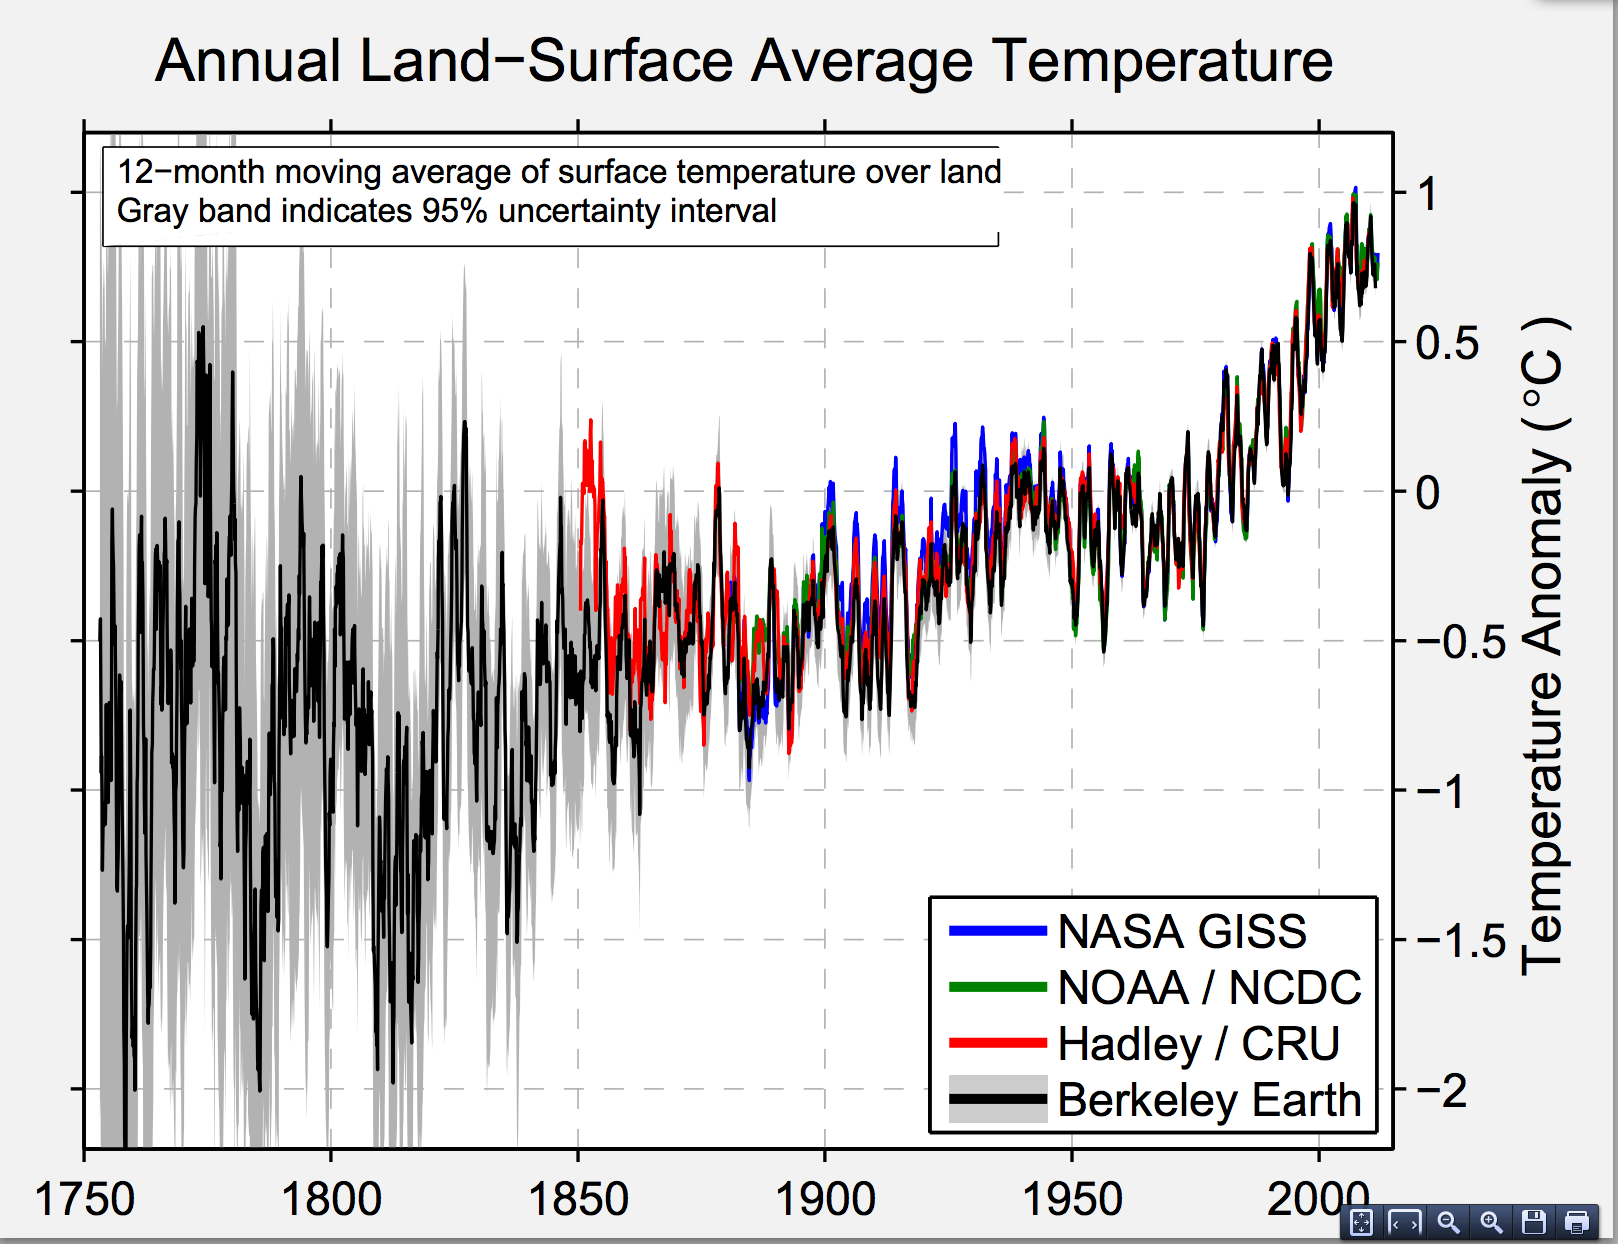
The Berkeley Earth Surface Temperature project is the most straightforward source for conclusions about warming in the recent past. The project was founded by Richard Muller, a physicist who was concerned about the treatment of the raw temperature measurements in some climate projections. At one point, there was a valid concern that the increasing average temperatures could be some sort of statistical artefact based on city growth (‘urban heat island’) or on the different spatial distribution and accuracy of recent and older monitors. This turned out not to be the case. Temperatures are increasing, systematically.  The Berkeley Earth estimate agrees very well with the NASA, NOAA, and Hadley/CRU estimates for recent decades
best

The grey band around the curve is also important. This is the random error. There basically isn’t any.  To be precise, for recent years, the difference between current and average temperatures is 20 to 40 times the uncertainty — compare this to the 5σ used in particle physics.

What there is uncertainty about is the future (where prediction is hard), and the causal processes involved. That’s not to say it’s a complete free-for-all. The broad global trends fit very well to a simple model based on CO2 concentration plus the cooling effects of major volcanic eruptions, but the detail is hard to predict.

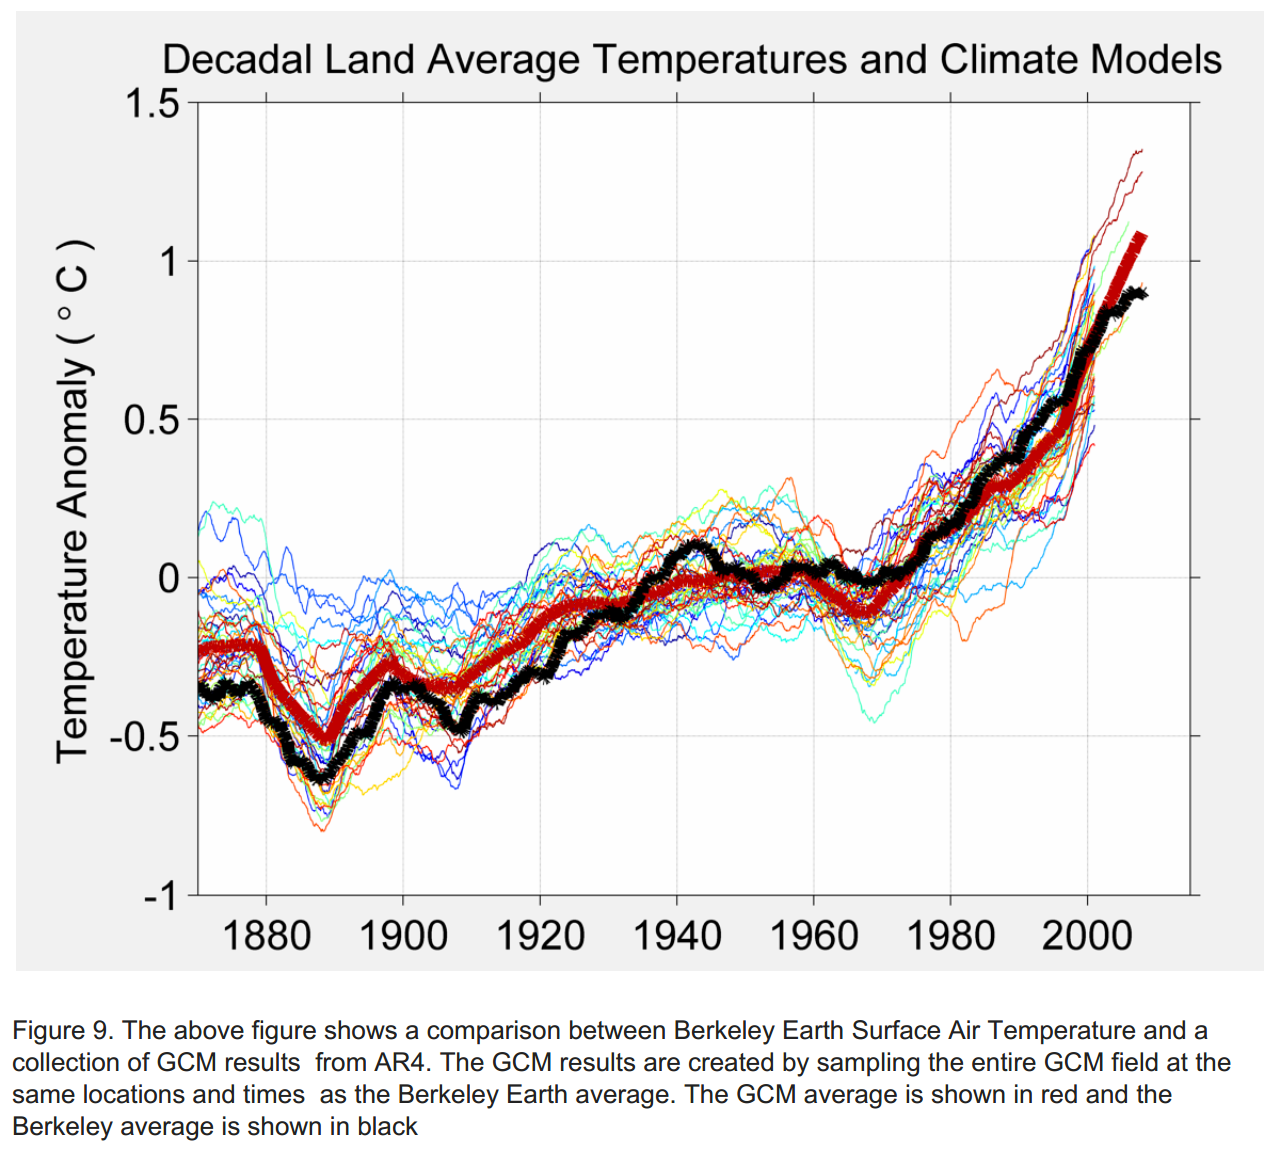
Berkeley Earth has a page comparing reconstructions of  temperatures with actual data for many climate models.  The models in the last major IPCC assessment report show a fairly wide band of prediction uncertainty — implying that future temperatures are more uncertain than current temperatures. The lines still all go up, but by varying amounts.
best-gcm


The same page has a detailed comparison of the regional accuracy of the models used in the new IPCC report. The overall trend is clear, but none of the models is uniformly accurate. That’s where the uncertainty comes from in the IPCC statements.

The earth has warmed, and as the oceans catch up there will be sea levels rises. That’s current data, without any forecasting.  There’s basically no uncertainty there.

It’s extremely likely that the warming will continue, and very likely that it is predominantly due to human-driven emissions of greenhouses gases.

We don’t know accurately how much warming there will be, or exactly how it will be distributed.  That’s not an argument against acting. The short-term and medium-term harm of climate changes increases faster than linearly with the temperature (4 degrees is much worse than 2 degrees, not twice as bad), which means the expected benefit of doing something to fix it is greater than if we had the same average prediction with zero uncertainty.

October 30, 2014

Cocoa puff

Both Stuff and the Herald have stories about the recent cocoa flavanols research (the Herald got theirs from the Independent).

Stuff’s story starts out

Remember to eat chocolate because it might just save your memory. This is the message of a new study, by Columbia University Medical Centre.


Sixteen paragraphs later, though, it turns out this isn’t the message

“The supplement used in this study was specially formulated from cocoa beans, so people shouldn’t take this as a sign to stock up on chocolate bars,” said Dr Simon Ridley, Head of Research at Alzheimer’s Research UK.


There’s a lot of variation in flavanol concentrations even in dark chocolate, but 900mg of flavanols would be somewhere between 150g and 1kg of dark chocolate per day.  Ordinary cocoa powder is also not going to provide 900mg at any reasonable consumption level.

The Herald story is much less over the top. They also quote in more detail the cautious expert comments and give less space to the positive ones. For example, that the study was very small and very short, and the improvement in memory was just in one measure of speed of very-short-term recall from a visual prompt, or that this measure was chosen because they expected it to be affected by cocoa rather than because of its relevance to everyday life. There was another memory test in the study, arguably a more relevant one, which was not expected to improve and didn’t.

Neither story mentions that the randomised trial also evaluated an exercise program that the researchers expected to be effective but wasn’t. Taking that into account, the statistical evidence for the effect of flavanols is not all that strong.

October 29, 2014

Briefly

  • The Herald reports on a genetic study in Finland that found a couple of rare genetic variants which were about 2.5 times more common in people who had committed multiple violent crimes.  I don’t have anything criticise about the story, just a point about genetics. When you’re trying to interpret an association like this one from a philosophical or policy point of view, it’s helpful to note that roughly 95% of their extremely violent criminals carried a genetic variant present in only 50% of the population — an odds ratio more like 25 than 2.5.
  • A story and interactive tool at Fusion, showing how changes in youth turnout would affect the US election results next week (if they happened, which they probably won’t).
  • From Anthony Tockar at Neustar, how anonymised taxi ride data from New York could be used to track passengers, not just drivers.
  • And the same taxi data being used for good, via mathbabe.org
October 28, 2014

Absolute, relative, correlation, cause

The conclusions of a recent research paper

Delivery by [caesarean section] is associated with a modest increased odds of [autism], and possibly ADHD, when compared to vaginal delivery. Although the effect may be due to residual confounding, the current and accelerating rate of[caesarean section] implies that even a small increase in the odds of disorders, such as [autism] or ADHD, may have a large impact on the society as a whole. This warrants further investigation.

The Herald

Babies born through Caesarean section are more likely to develop autism, a new study says.

Academics warn the increasingly popular C-section deliveries heighten the risk of the disorder by 23 per cent.

There’s a fairly clear difference in language: the news story is fairly clearly implying that caesarean sections cause autism; the research paper is being scrupulously careful not to say that.

Using a relative risk is convenient in technical communication, but in non-technical communication makes the impact seem greater than it really is. The US Centers for Disease Control estimate a risk of 1 in 68 for autism spectrum disorder (there aren’t systematic NZ data).  If the correlation with C-section really is causal, we’re talking about roughly 14 kids with autism spectrum disorders per 1000 without a C-section and about 17 per 1000 with a C-section. The absolute risk increase, if it’s real, is about 3 cases per 1000 C-sections.

It’s also important to be clear that this correlation cannot explain much of the recent increases in autism. A relative risk of 1.23 means that if we went from no C-sections to 100% C-sections there would be a 23% increase in autism spectrum disorder. The observed increase is about five times that, and since  C-sections have only increased about 10 percentage points, not 100 percentage points, the observed increase in autism is about 50 times what this correlation could explain.

There are (I’m told by people who know the issues) good reasons to think there are too many C-sections.  This probably won’t be one of the most important ones.


October 24, 2014

Something in the air

There’s a story “Pollution can cause lung problems in unborn baby – research” in the Herald, which I’m not  convinced by, but the reasons are relatively subtle.

The researchers compared levels of traffic-related air pollution exposure for different pregnant women, and looked at the lung function of the children at age four and a half (press release).  The story gets the name of the main pollutant (nitrogen dioxide) wrong in two different ways, but is otherwise a good summary.  It’s all correlation, but weaker associations than this are fairly reliably estimated for short-term exposures to air pollution. Long-term exposure is different, and that’s what’s interesting.

Studies of short-term effects of air pollution compare the number of people dying or going to hospital on days when pollution is high to the number on days where pollution is low.  That is, the comparisons of pollution are for the same people and for the same air pollution monitors. There are a fairly limited selection of other factors that could explain the association — the main ones being related to weather.

Studies of longer-term effects compare people with high exposure to pollution and people with low exposure to pollution.  Actually, they don’t quite do that, because air pollution monitoring is expensive in labour and equipment. They compare people with high estimated exposure and low estimated exposure. Since we’re comparing different people, any factor that affects health and also affects where people live could cause a bias, and it’s very well established that poorer people tend to get exposed to more pollution, at least in cities. Also, since we’re comparing different air pollution monitors, there can be biases from how representative the monitors are of the local area.

These problems mean that it’s much harder to be confident about effects of longer-term air pollution exposure, even though these effects are likely to be bigger than the short-term ones. Fortunately, we don’t need to be sure of these effects in setting public policy. The main source of the pollution is traffic, and there are other independent reasons why we want to have fewer cars burning less fuel.

On the statistical generalisability of personal experience

Going by people I know in real life or on Twitter, you would think the majority of people brought up in the Mormon church become scientists. though I am informed this is not actually the case.

There’s an interview with one of them, Heather Hendrickson, in the Herald.

October 23, 2014

Official Information and Open Data

In recent years it has become much easier to just go and get routine government data. It’s now easy to put data up online, and organisations do it. We might whinge about how often the URLs and layouts change, but you can get and reuse information in ways that used to be impossible. For examples in just one field, see the blog of the NZ geodata company Koordinates.

On the other hand, non-routine requests seem to be increasingly difficult. David Fisher, of the Herald, gave a talk in Wellington last week on the Official Information Act. The talk has been published at Public Address

When I started, if I wanted to know about something, I would ring and ask. For example, if I want to know about how Kauri stumps were exported, I would ring up the equivalent of the MPI and ask how Kauri stumps get exported. I would then spend half an hour on the phone to the guy who oversaw the exporting – often the guy who was physically down at the docks – and I would be informed.

It seems a novel idea now. I can barely convey to you now what a wonderful feeling that is, to be a man with a question the public wants answering connecting with the public servant who has the information.

Things have changed, he says.

October 22, 2014

Screening the elderly

I’ve seen two proposals recently for population screening of older people. They’re probably both not good ideas, but for different reasons.

We had a Stat of the Week nomination for a proposal to screen people over 65 for depression at ordinary GP visits, to prevent suicide. The proposal was based on the fact that 70% of the suicides were in people who had visited a GP within the past month.  If the average person over 65 visits a GP less than about 8.5 times a year, this means those visiting their GP are at higher risk.  However, the risk is still very small: 225 over 5.5 years is 41/year, 70% of that is 29/year.

To identify those 29, it would be necessary to administer the screening question to a lot of people, at least hundreds of thousands. That in itself is costly; more importantly, since the questionnaire will not be perfectly accurate there will be  tens of thousands of positive results. For example, a US randomised trial of depression screening in people over 60 recruited 600 participants from 9000 people screened. In the ‘usual care’ half of the trial there were 3 completed suicides over the next two years; in those receiving more intensive and focused help with depression there were 2. The trial suggests that screening and intensive intervention does help with symptoms of major depression (probably at substantial cost), but it’s not likely to be a feasible intervention to prevent suicide.


The other proposal is from the UK, where GPs will be financially rewarded for dementia diagnoses. In contrast to depression, dementia is pretty much untreatable. There’s nothing that modifies the course of the disease, and even the symptomatic treatments are of very marginal benefit.

The rationale for the proposal is that early diagnosis gives patients and their families more time to think about options and strategies. That could be of some benefit, at least in the subset of people with dementia who are able and willing to talk about it, but similar advance planning could be done — and perhaps better — without waiting for a diagnosis.

Diagnosis isn’t like treatment. As a British GP and blogger, Martin Brunet, points out

We are used to being paid for things of course, like asthma reviews and statin prescribing, and we are well aware of the problems this causes – but at least patients can opt out if they don’t like it.

They can refuse to attend a review, decline our offer of a statin or politely take the pill packet and store it unopened in the kitchen cupboard. They cannot opt out of a diagnosis.