Posts written by Thomas Lumley (2645)

avatar

Thomas Lumley (@tslumley) is Professor of Biostatistics at the University of Auckland. His research interests include semiparametric models, survey sampling, statistical computing, foundations of statistics, and whatever methodological problems his medical collaborators come up with. He also blogs at Biased and Inefficient

March 9, 2014

Briefly

  • Rafa, at Simply Statistics, shows that countries with higher GDP per capita also tend to have had women voting for longer. Yes, he does know about correlation and causation.
  • Felix Salmon writes about, essentially, Bayesian updating given conflicting information the probability that Dorian is Satoshi would seem to be very small, and the the probability that Dorian is not Satoshi would seem to be just as small — and yet, somehow, when you add the two probabilities together, the total needs to come to something close to 100%.
  • Viz for a cause, an new archive of for data visualisations advocating on various causes. The current examples come from Tableau Public, which might be worth a look for online displays.
  • Andrew Gelman onHow much time (if any) should we spend criticizing research that’s fraudulent, crappy, or just plain pointless?” You can tell my answer from StatsChat. When it’s just consenting scientists in the journals, I’ve got better things to do. When there’s enough PR applied to get it into the NZ media, I try to respond. Sometimes it’s bad science; often it’s perfectly good underlying science and bad press releases. Remember, almost nothing from the scientific literature gets into the papers accidentally. Someone — the scientist, the journal, the university — has to push.
March 7, 2014

Careers in statistics

From Science Careers

“[The Bureau of Labor Statistics] projects that statistics jobs will grow 27% from 2012 to 2022, putting the profession in the “much faster than the average for all occupations” growth category. The bureau puts statisticians’ median annual salary in 2012 at $75,560.

In addition to having a different quote from Hal Varian than the one you were expecting, they talk to statisticians including Xihong Lin and Montse Fuentes.

Graphics design rules

1. Barcharts must start at zero,  from Storytelling with Data

2. Infographics as a proxy for overall news quality (barcharts must start at zero), from The Functional Art

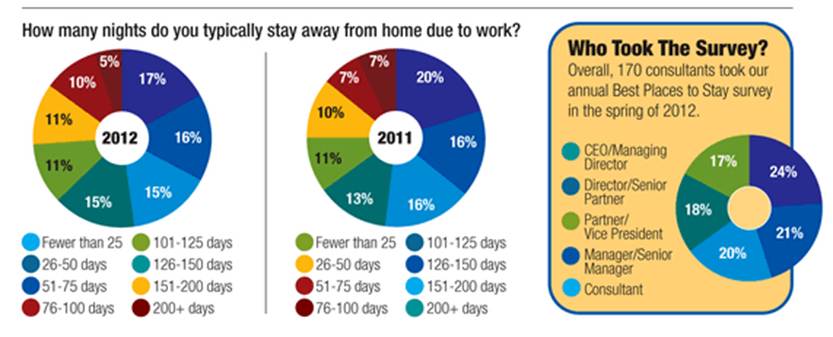
3. And, from Storytelling with Data, perhaps the worst use of colour ever in donut charts. Statisticians keep saying it’s hard to compare pie/donut charts reliably. Notice how the two donuts below look very similar? Now try looking at the legends

donut

Remember: U and DON’T makes DONUT.

March 6, 2014

Attack of the killer lamb?

Not, not that one, the story about eating meat.

Stuff has the more egregious version “Eating meat ‘as bad as smoking‘”, the Herald has the rather better “Protein packed diet nearly as bad as smoking – expert”.

First, the good bits. Both stories are better than the UK versions: the Herald talks to Australian experts and brings in a related study; the Fairfax story at least mentions an outside scientific opinion and gives a link (though it’s to the university press release, which doesn’t link further to the research paper).

The researchers compared people who ate high-protein diet (just under 20% of the people) to those who ate a low-protein diet (just over 5%), and found a 70% higher rate of death in the high-protein group, in people aged 55-64.  The study was observational, but it was in a representative sample of the US and was backed up by experiments in mice. That’s not completely reliable,  but it is a big step.

The 70%-higher-rate of death for  high-protein vs low-protein diets compares to slightly over 100% higher rate for current smokers vs non-smokers in previous research using data from the same survey. You could get away with calling that ‘nearly as bad’, especially as other surveys have tended to give smaller differences. So, the Herald’s headline is defensible. Stuff’s headline drops the ‘nearly’, the ‘packed’ and refers to ‘meat’ rather than ‘protein’. It would be easy for a casual reader to get the false impression that the research had found eating meat was as bad as smoking.

There are two really big holes in the coverage, though.  The Herald alludes to one of them but doesn’t follow up 

People on high-protein diets are likely to lose years of life along with the weight they shed, according to two studies.

All the statistical analyses in the paper attempted to control for weight, ie, they were trying to compare people on high and low protein diets with the same weight. That’s not the relevant question for many people on these diets — the attraction of the diet is that it’s easier to lose weight.  The relevant question for them is a comparison between a high-protein diet with lower weight or a low-protein diet with higher weight.  That question could have been addressed with the data, but it wasn’t.

A rather less subtle omission is that neither story, nor the press release, mentions a key point of the paper: that the association reverses in people over 65.

March 5, 2014

Planes and buses

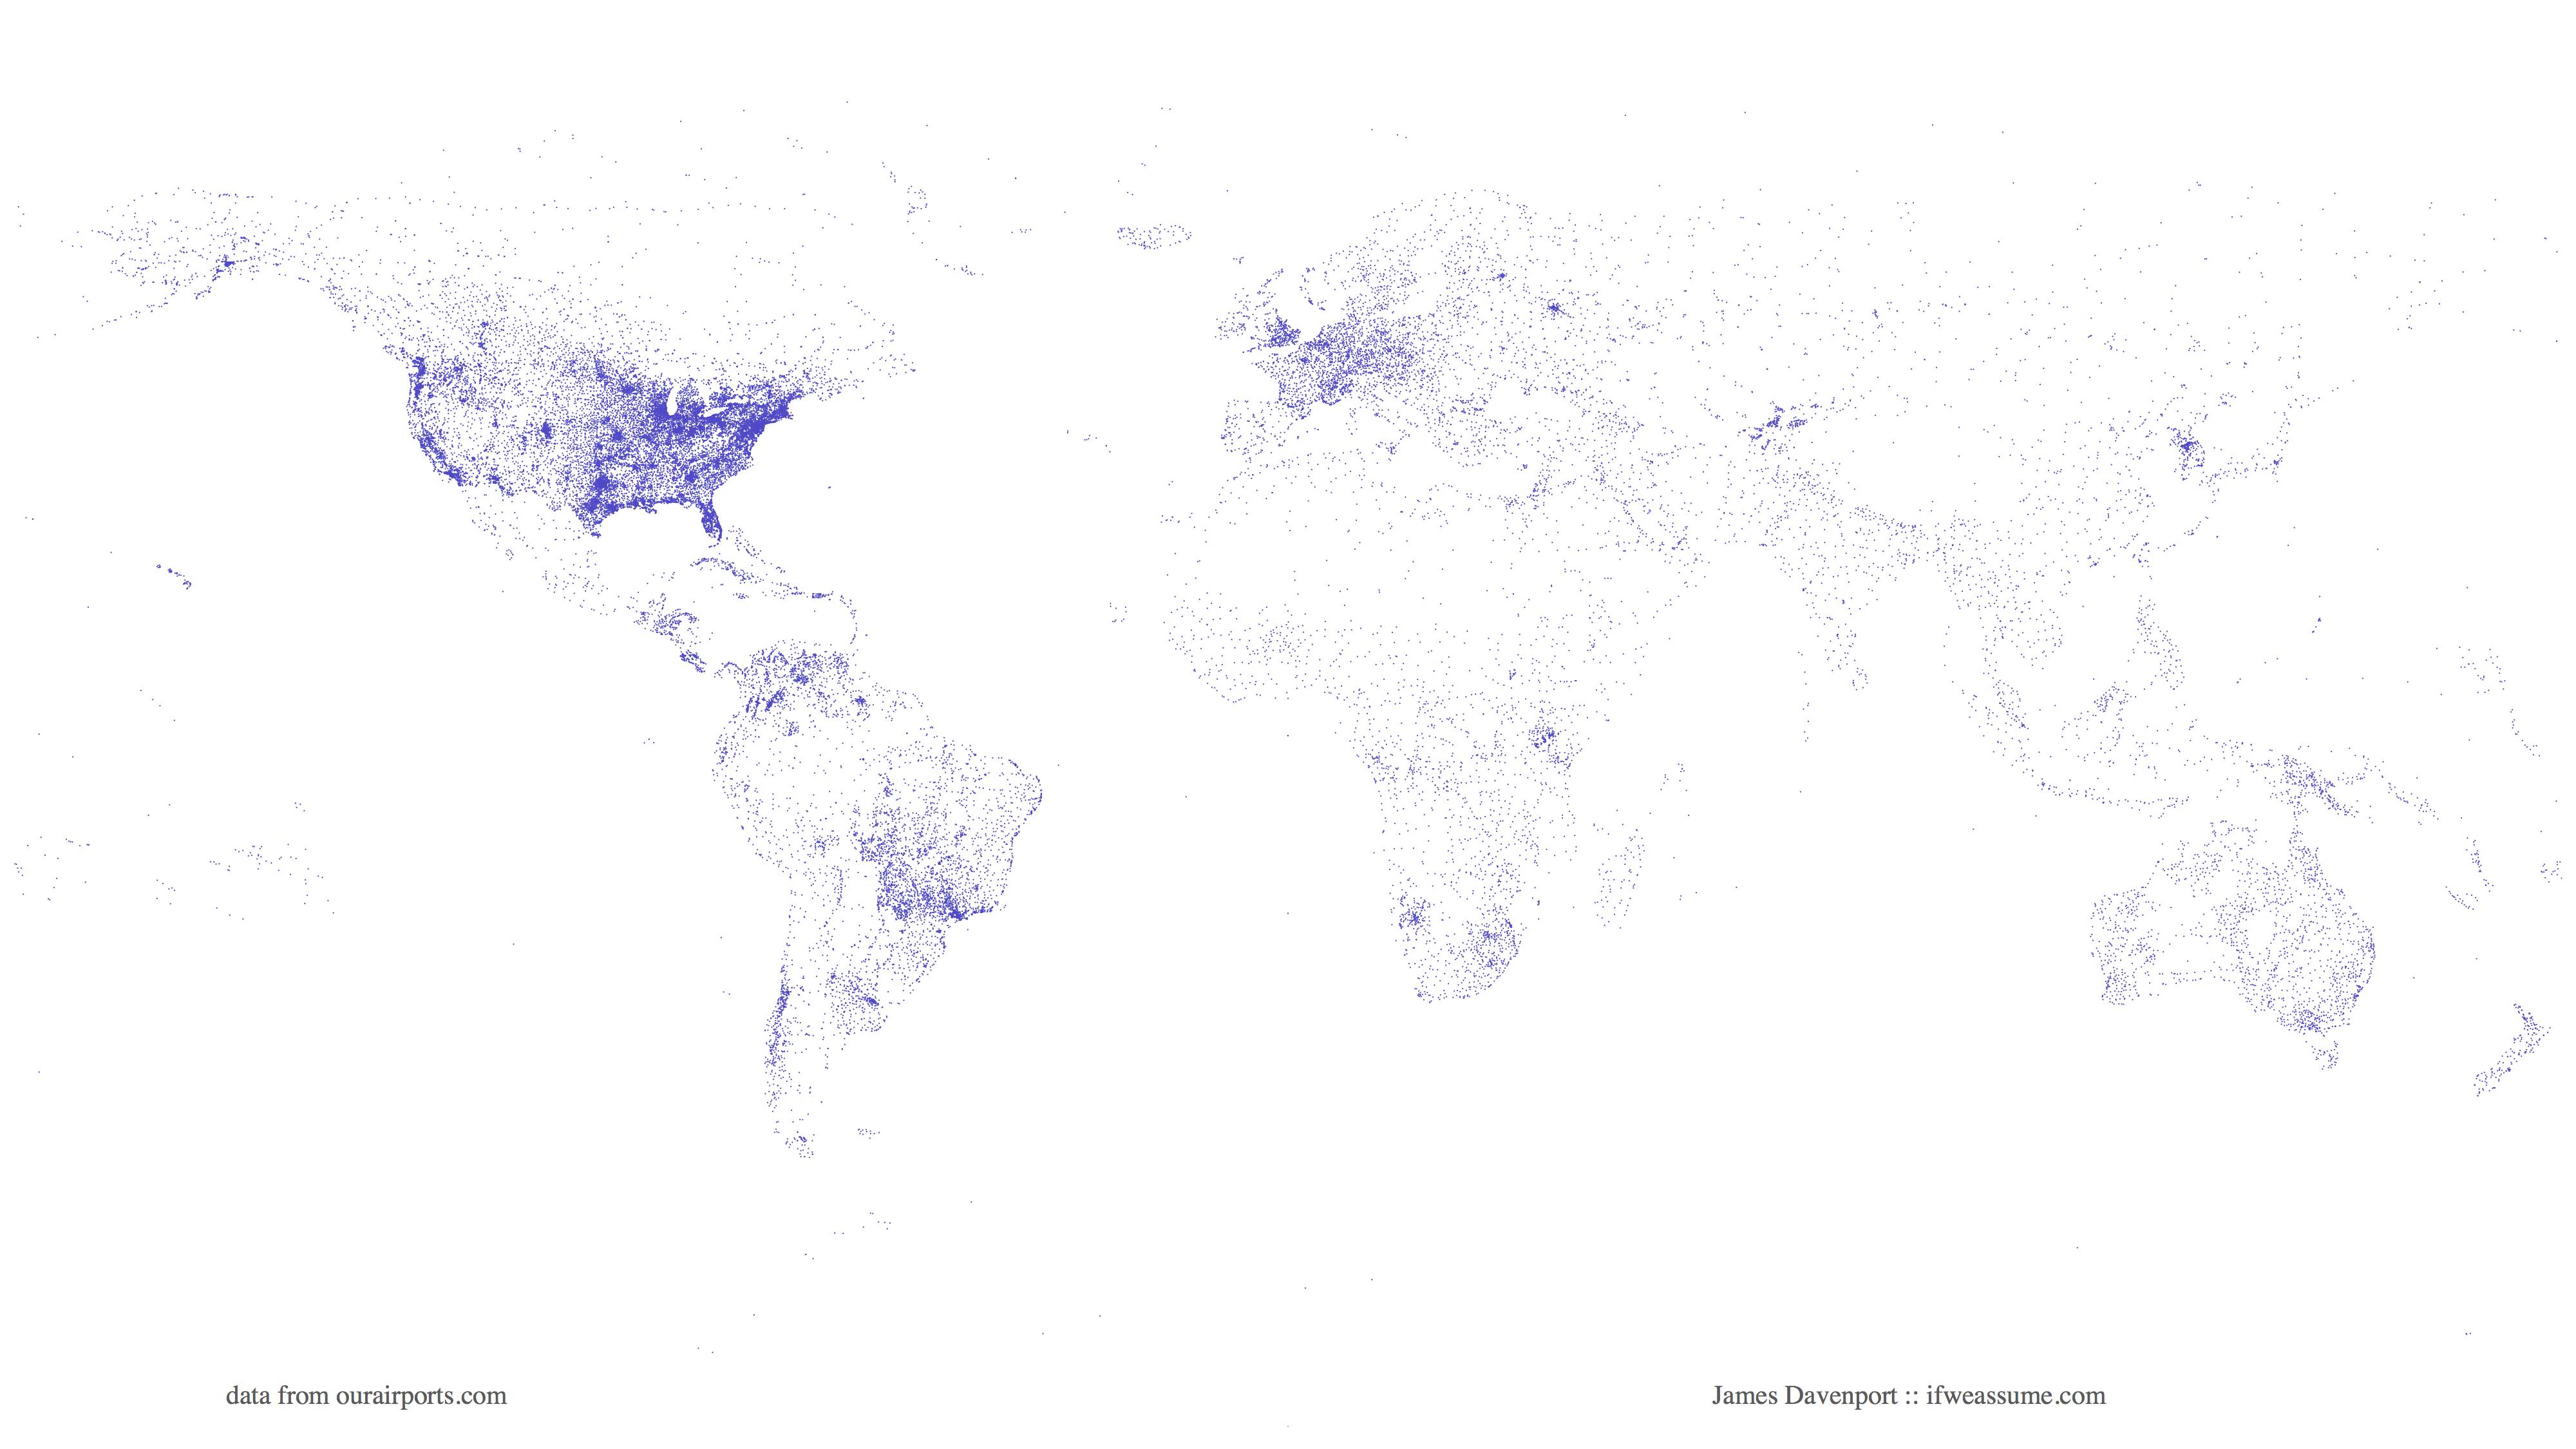
Maps from James Davenport

First, the world’s airport runways (go to his site for all the  details)

airports


You can see which bits of central Australia have farms or mines. Another interesting feature is the chain of evenly-spaced runways across far northern Canada — the DEW line.

He also has a video showing locations of all the buses in Seattle, over a 24-hour period. Like Auckland, Seattle has a real-time bus location system. Unlike Auckland’s system it produces openly-accessible data.

March 4, 2014

Briefly

  • Auckland Counts: local maps of NZ Census data thanks to Auckland Council RIMU. (via @kamal_hothi)

Civil Rights Principles for the Era of Big Data

From a mostly left-wing (ie, NZ middle-of-the-road) group of US civil-rights organisations, but at least some of it will also appeal to libertarians. If you think this sort of thing is interesting/important a good place to find more is mathbabe.org.

Technological progress should bring greater safety, economic opportunity, and convenience to everyone. And the collection of new types of data is essential for documenting persistent inequality and discrimination. At the same time, as new technologies allow companies and government to gain greater insight into our lives, it is vitally important that these technologies be designed and used in ways that respect the values of equal opportunity and equal justice. We aim to:

  1. Stop High-Tech Profiling. New surveillance tools and data gathering techniques that can assemble detailed information about any person or group create a heightened risk of profiling and discrimination. Clear limitations and robust audit mechanisms are necessary to make sure that if these tools are used it is in a responsible and equitable way.
  2. Ensure Fairness in Automated Decisions. Computerized decisionmaking in areas such as employment, health, education, and lending must be judged by its impact on real people, must operate fairly for all communities, and in particular must protect the interests of those that are disadvantaged or that have historically been the subject of discrimination. Systems that are blind to the preexisting disparities faced by such communities can easily reach decisions that reinforce existing inequities. Independent review and other remedies may be necessary to assure that a system works fairly.
  3. Preserve Constitutional Principles. Search warrants and other independent oversight of law enforcement are particularly important for communities of color and for religious and ethnic minorities, who often face disproportionate scrutiny. Government databases must not be allowed to undermine core legal protections, including those of privacy and freedom of association.
  4. Enhance Individual Control of Personal Information. Personal information that is known to a corporation — such as the moment-to-moment record of a person’s movements or communications — can easily be used by companies and the government against vulnerable populations, including women, the formerly incarcerated, immigrants, religious minorities, the LGBT community, and young people. Individuals should have meaningful, flexible control over how a corporation gathers data from them, and how it uses and shares that data. Non-public information should not be disclosed to the government without judicial process.
  5. Protect People from Inaccurate Data. Government and corporate databases must allow everyone — including the urban and rural poor, people with disabilities, seniors, and people who lack access to the Internet — to appropriately ensure the accuracy of personal information that is used to make important decisions about them. This requires disclosure of the underlying data, and the right to correct it when inaccurate.

As an example, consider this Chicago crime risk profiling system. Is it worrying? If so, why; if not, why not?

What you don’t know

The previous post was about the failure of the ‘deficiency model’ of communication, which can be caricatured as the idea that people who believe incorrect things just need knowledge pills.

Sometimes, though, information does help. A popular example is that providing information to university students about the actual frequency of binge drinking, drug use, etc, can reduce their perception that ‘everyone is doing it’ and reduce actual risky  behaviour.

So, it’s interesting to see these results from a US survey about same-sex marriage

Regular churchgoers (those who attend at least once or twice a month), particularly those who belong to religious groups that are supportive of same-sex marriage, are likely to over- estimate opposition for same-sex marriage in their churches by 20 percentage points or more.

  • „„About 6-in-10 (59%) white mainline Protestants believe their fellow congregants are mostly opposed to same-sex marriage. However, among white mainline Protestants who attend church regularly, only 36% oppose allowing gay and lesbian people to legally marry while a majority (57%) actually favor this policy.
  • Roughly three-quarters (73%) of Catholics believe that most of their fellow congregants are opposed to same-sex marriage. However, Catholics who regularly attend church are in fact divided on the issue (50% favor, 45% oppose).

For survey nerds, the sampling methodology and complete questionnaire are also linked from that web page.

What you do know that ain’t so

From a randomised trial of four different sets of information about vaccine benefits (via Brendan Nyhan)

Parents were randomly assigned to receive 1 of 4 interventions: (1) information explaining the lack of evidence that MMR causes autism from the Centers for Disease Control and Prevention; (2) textual information about the dangers of the diseases prevented by MMR from the Vaccine Information Statement; (3) images of children who have diseases prevented by the MMR vaccine; (4) a dramatic narrative about an infant who almost died of measles from a Centers for Disease Control and Prevention fact sheet; or to a control group.

In particular, intervention 4 is a popular and sensible idea, and it has occurred to people from Benjamin Franklin to Kiwi parents and the Herald. However:

RESULTS: None of the interventions increased parental intent to vaccinate a future child. Refuting claims of an MMR/autism link successfully reduced misperceptions that vaccines cause autism but nonetheless decreased intent to vaccinate among parents who had the least favorable vaccine attitudes. In addition, images of sick children increased expressed belief in a vaccine/autism link and a dramatic narrative about an infant in danger increased self-reported belief in serious vaccine side effects.

This research is depressing from the point of view of science communication. The problem is that the message goes in two apparently opposite ways.  One conclusion is that increasing trust in science and medicine is the only solution, which would require more public contact and communication, and openness about uncertainty.  The other conclusion is that a public health advertising campaign is a treatment, and like any other treatment it should be evaluated for safety and effectiveness before it’s applied to the population, an approach that seems to imply a reduction in open and unfiltered communication.

I don’t think the contradiction is unavoidable; I think more communication about research process — who are we and what do we actually do — will help, but also that advertising, whether government-funded or pushed by PR departments, is actually dangerous.  If we overstate claims about the biochemical effects of compounds in chocolate, or the number of deaths prevented by lowering the blood alcohol limit, why should we be trusted on important issues?


March 1, 2014

It’s cold out there, in some places

Next week I’m visiting Iowa State University, one of the places where the discipline of statistics was invented. It’s going to be cold — the overnight minimum on Sunday is forecast at -25C — because another of the big winter storms is passing through.

The storms this year have been worse than usual. Minneapolis (where they know from cold) is already up to its sixth-highest number of days with the maximum below 0F (-18C, the temperature in your freezer). The Great Lakes have 88% ice cover, more than they have had for twenty years.

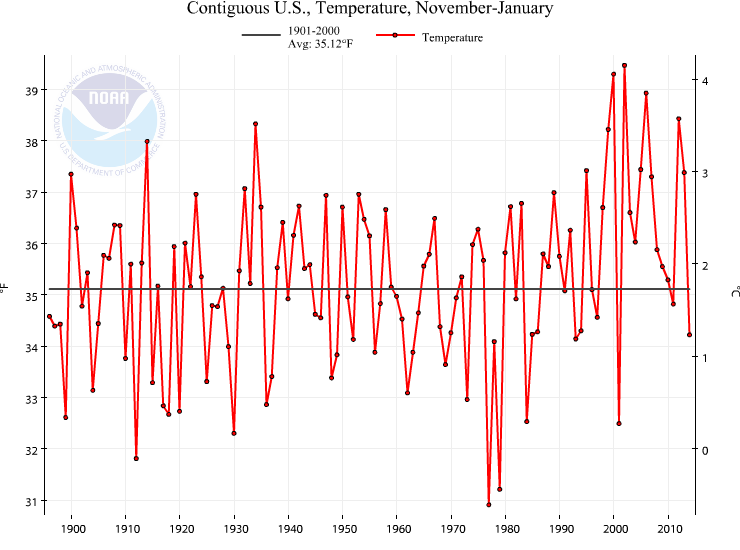
Looking at data from NOAA, this winter has been cold overall in the US, very slightly below the average for the past century or so.

us

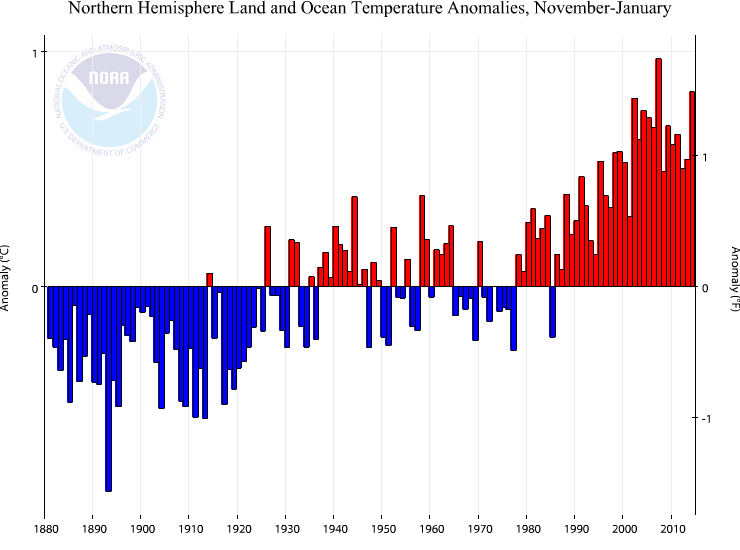
However, that’s just the US. For the northern hemisphere as a whole, it’s been an unusually warm winter, well above historical temperatures

hemisphere


This has been your periodic reminder that weather news, for good reasons, gives you a very selective view of global temperature.