Posts written by Thomas Lumley (2645)

avatar

Thomas Lumley (@tslumley) is Professor of Biostatistics at the University of Auckland. His research interests include semiparametric models, survey sampling, statistical computing, foundations of statistics, and whatever methodological problems his medical collaborators come up with. He also blogs at Biased and Inefficient

February 6, 2014

Briefly

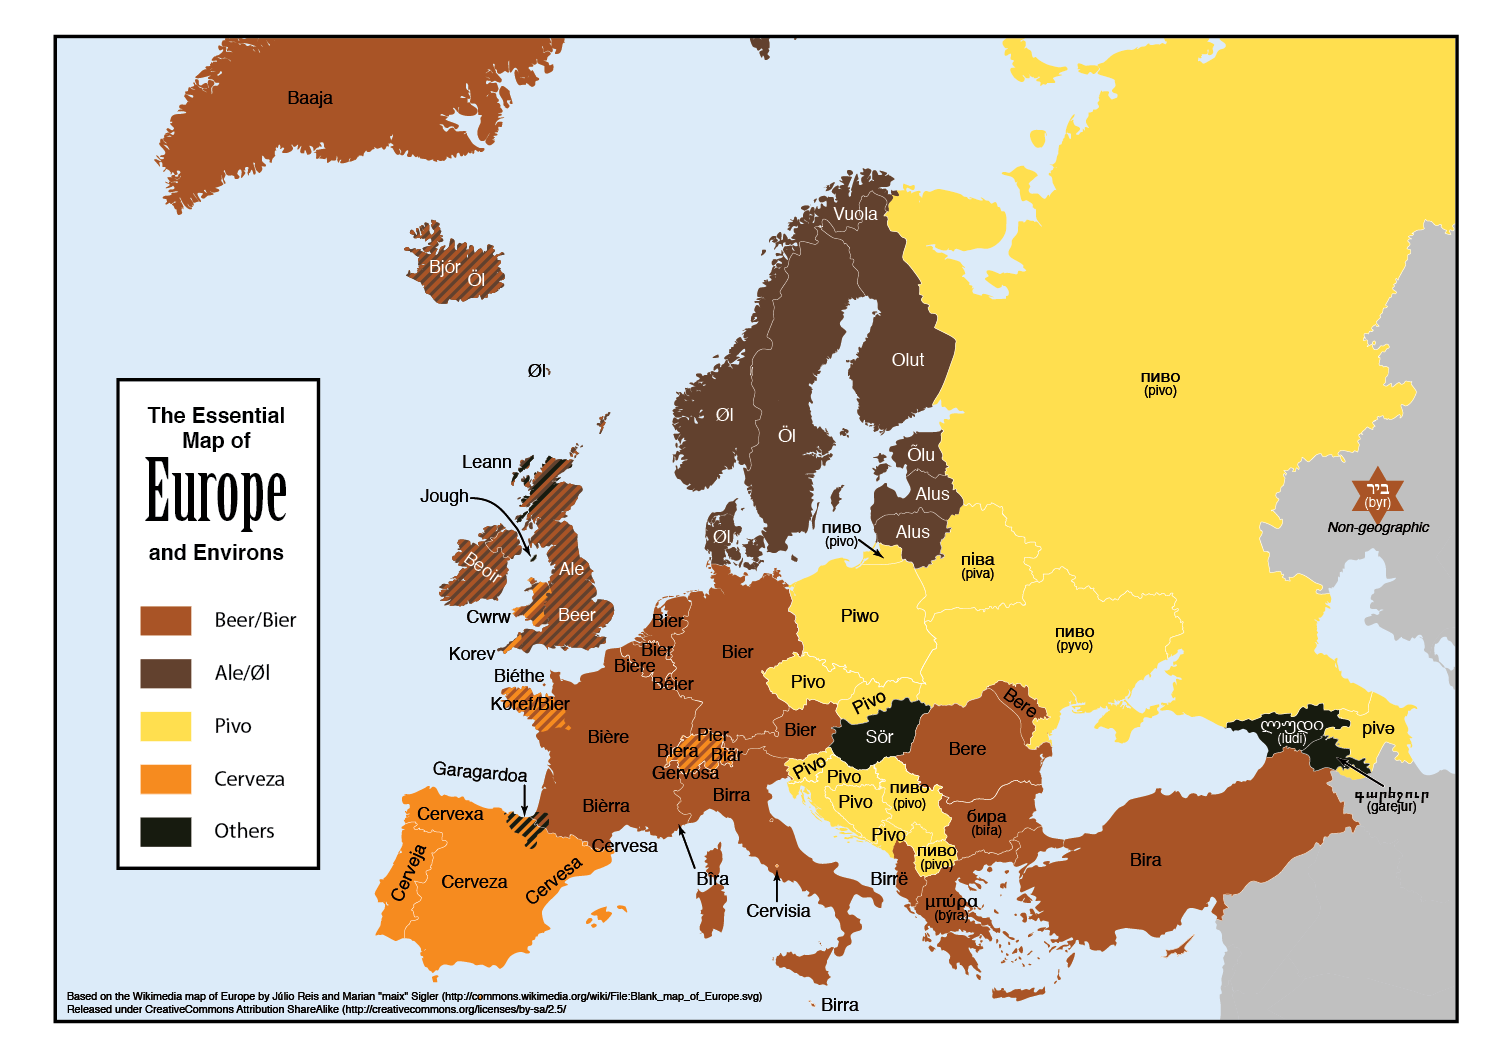
Eurobeer-map

  • From Derek Lowe, a post about recent research suggesting antioxidants may be positively bad for you (translation note: ‘reactive oxygen species’ is roughly what used to be called ‘free radicals’ in this context)
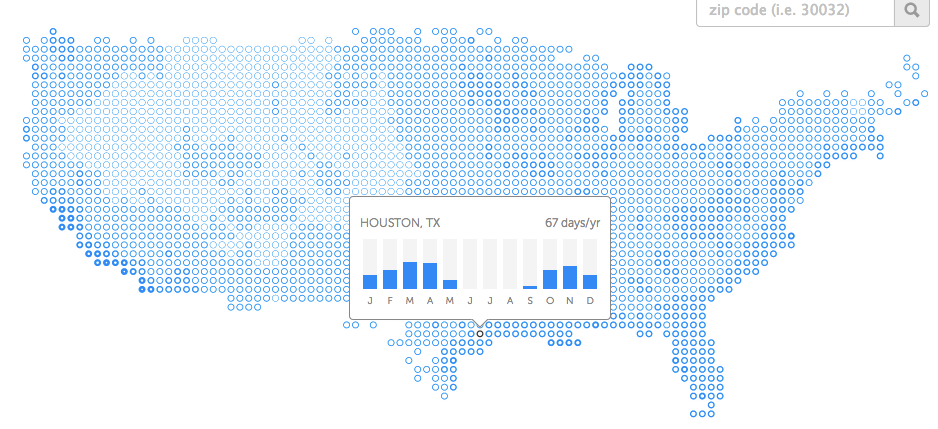
  • Kelly Norton has an interactive map showing the number of ‘pleasant’ days per year in parts of the US. The projection is a bit ugly but the data are interesting.  By his definition, essentially all Auckland days without rain are ‘pleasant’, so Auckland has about 165 pleasant days per year, putting it ahead of everywhere except a few places on the California coast. The key thing he misses out is humidity, so the map says Flagstaff, Arizona has a much less pleasant climate than Chicago, which will be news to many people.

nice

I’m currently in Houston, where it’s pleasant

February 5, 2014

With friends like these

Stuff has fallen for an egregiously over-promoted paper on future temperature-related deaths in the UK

Deaths caused by hot weather are projected to rise by more than 250 per cent, with the elderly most at risk, the New Zealand Doctor magazine reported today.

The increased death rate, driven by climate change, population growth and ageing, would occur by the middle of the century, according to research published in the Journal of Epidemiology and Community Health on Monday.

It was found that “in the absence of any adaptation of the population”, heat-related deaths would be expected to rise by about 257 per cent by the 2050s, and cold-related mortality would decline by 2 per cent.

Stuff attributes this story to NZ Doctor, but all they did was reprint an explicitly unedited Green Party press release. [update: it looks as though NZ Doctor did also have a story that provided the last four paragraphs of the Stuff story]

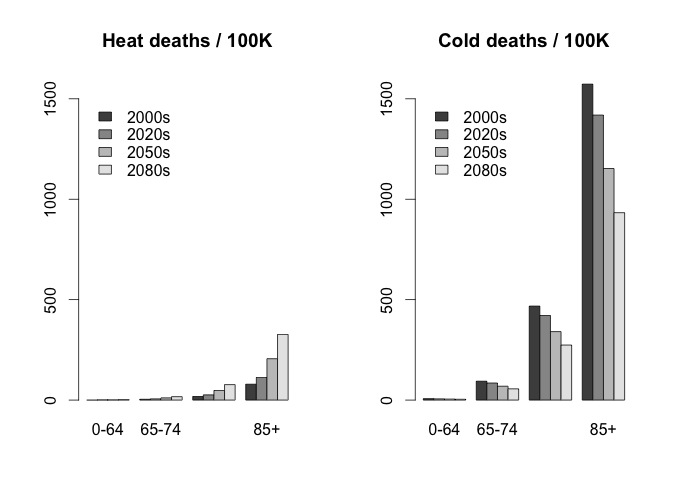
Professor David Spiegelhalter has already savaged this one elegantly on his blog.  All the projected increase in temperature-related deaths in the UK is due to the increase in the number of elderly people.

If you compare people of the same age, the projections say cold-related deaths will fall by about twice as much as heat-related deaths rise, as his graph of the numbers from the paper shows.  That is, the paper actually predicts that global warming will reduce the number of temperature-related deaths in the UK.

bar chart of age-standardised deaths, showing decreases are larger than increases

In the USA or Australia, let alone Africa, India, and other less-wealthy tropical places, there is going to be a real problem with temperature-related deaths from global warming.  In many more parts of the world, there’s a potential for weather-related deaths from drought, flood, storm, and ‘tropical’ disease.

Heat waves in the UK are not in the top ten list of things to worry about from global warming. Pretending they are is likely to be counterproductive.

Sweet as

The Herald gets a bit excitable about a JAMA Internal Medicine paper saying it’s not healthy to eat lots and lots of sugar. The story says

One sugar-sweetened beverage a day is enough to increase the risk of dying from cardiovascular disease (CVD) affecting the heart and arteries.

With the statistical analysis done in the paper that’s really an assumption, not a conclusion — the analysis assumes an exponentially-increasing risk for additional sugar consumption, so if lots of sugar is bad, a little bit will automatically be thought to be bad.

The Herald’s lead was

Consuming too many sugary sweets, desserts and drinks can triple your chances of dying from heart disease.

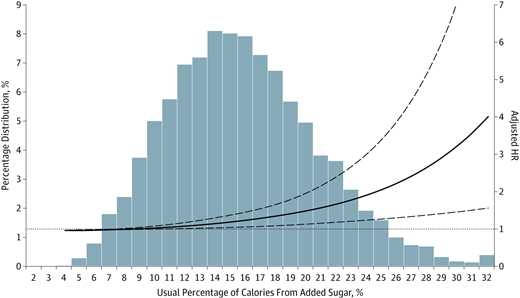
That’s pretty much what the research paper says, but as always “compared to what?”  Here’s the graph from the paper showing the estimated risk (solid line), the uncertainty, and the actual distribution of people’s sugar consumption

m_ioi130135f1


There’s a lot of uncertainty around the risk line, even assuming that the model is correct. More importantly, most people, even in the US, aren’t anywhere near the levels of sugar consumption that get you a tripling of risk.

There’s more detailed commentary at the UK “Behind the Headlines”. Eating lots of additional sugar isn’t good for you. But you knew that already.

Gambling problems

From Stuff

New Zealanders are the world’s fourth-biggest gamblers per capita, new figures show.

The figures come from H2 Gambling Capital, an international gaming research agency, and have been published in the Economist magazine.

This is unusually accurate for a ‘top in the world’ story, the only quibbles being that the data were actually published in one of the Economist blogs, and the data is on  gambling in New Zealand, not on  gambling by New Zealanders — it includes gambling by tourists.

More worrying is the last sentence of the story

The Ministry of Health reports that most New Zealand gamblers are recreational gamblers, with about 0.3 per cent of the population at risk of “problem gambling”.

In fact, the Ministry of Health reports that about 0.3% of the population are actually problem gamblers, “gambling at levels that are leading to negative consequences”,  with another 1% at moderate risk.

February 4, 2014

Keep off the E. coli

It’s not that I deliberately set out to write about the Daily Mail stories in the Herald. I decide to write a post before I get to the source line at the end. It’s just that the really bad stories tend to be imports.

Today’s story starts

Your friend swears by the Atkins diet, your colleague loves Paleo and your neighbour is raving about gluten-free.

So which diet works? Perhaps all of them, according to new research which claims dieting is all in your genes.

In a recent study, scientists claim to have identified a collection of genes that allow humans to adapt to different diets.

Actually

Here we show that Caenorhabditis elegans lifespan is regulated by their adaptive capacity to different diets, which is controlled by alh-6, a conserved proline metabolism gene. alh-6 mutants age prematurely when fed an Escherichia coli OP50 but not HT115 diet.

That is, the research is in mutant nematodes. Not humans. Not mice. Not even fruit flies. The mutations completely disabled the gene. In humans that is extremely rare (though cases have been described). Even in mutant nematodes the dietary difference had nothing to do with weight loss, which is the most common reason for people to diet. And it wasn’t that different diets were better depending on the genetic variant, it was that the difference between a bad diet and a good diet was larger in nematodes with a broken version of this gene.  And the bad diet was composed of E. coli bacteria, which don’t feature highly in Atkins, Paleo, or gluten-free. And.. just no.

It is interesting to see how the claims developed through the chain of citation. The abstract of the paper says

Collectively, our data reveal a homeostatic mechanism that animals employ to cope with potential dietary insults and uncover an example of lifespan regulation by dietary adaptation.

and the paper makes no claims about genetic sequencing or human diets.

The University of Southern California press release says

Your best friend swears by the Paleo Diet. Your boss loves Atkins. Your sister is gluten-free, and your roommate is an acolyte of Michael Pollan. So who’s right? Maybe they all are.

In new research published this month in Cell Metabolism, USC scientists Sean Curran and Shanshan Pang identify a collection of genes that allow an organism to adapt to different diets and show that without them, even minor tweaks to diet can cause premature aging and death.

Finding a genetic basis for an organism’s dietary needs suggests that different individuals may be genetically predisposed to thrive on different diets – and that now, in the age of commercial gene sequencing, people might be able to identify which diet would work best for them through a simple blood test.

introducing the trendy diets and the idea of gene sequencing to guide diets. This was also reprinted in shortened form at Science Daily.

The Daily Mail then reorganised the first paragraph, dropped Michael Pollan (whether because he’s less famous in the UK or because he’s more of a Guardian type) and introduced the assertion that the research found something about humans (rather than that it could be extrapolated to humans).   And the Herald reprinted it.

If you want to know whether a particular reasonably sane diet will work for you, the best way is to try it. That was true in the past, it’s true now, and it’s going to be true for a long time, even with advances in genetics.

 

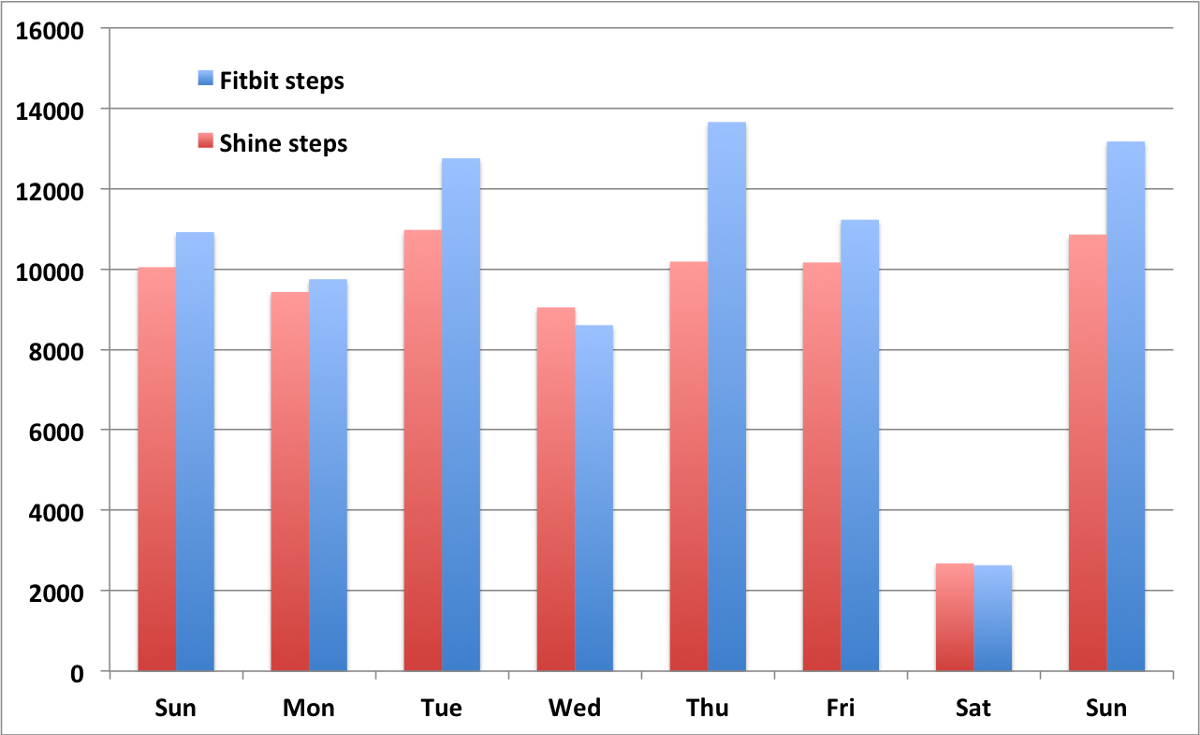
Approximately quantified self

What happens if you wear two activity-monitoring devices at the same time, on the same wrist:

fitbit-shine


February 3, 2014

Abstinence at a distance

The Herald has a headlineDry January may not have been as good for your health as you thought“, and lead

For many people, the beginning of February marks the end of a month of abstinence from their favourite tipple.

But as we bid a perhaps too enthusiastic farewell to Dry January, one expert is saying that last month’s good intentions may have done more harm than good.

Now, ‘Dry January’ almost certainly has done no real harm or good to readers of the Herald, since it’s a UK thing, and it would be quite hard for British alcohol consumption to have much impact on NZ health.  The story, amazingly, hasn’t even been edited to mention the NZ analog, FebFast, which has just started on Saturday.

With that out of the way, the point of the story is that moderate levels of alcohol consumption are probably beneficial to health, and so giving up alcohol for a month does more harm than good. While it’s nice to see the J-curve acknowledged in the media, it’s unlikely to apply here. If you have any real reason to join the ‘Dry January’ campaign, you’re probably drinking enough to be on the unhealthy side of the curve (like many people in NZ), and the health risks go up fairly fast with increased consumption.  If giving up alcohol for a month does you any good, except in the wallet, it’s likely to do quite a bit more good than harm. It’s true that drinking moderately without a month off would be even better, but that’s not the intervention at issue.

It’s also worth noting that the benefits claimed for beer in the story include its silicon content. That’s a fairly reliable sign of desperation in nutrition claims; it’s not clear that anyone has ever been short of silicon.

Cycling safety

The Herald reports on a nice comparison of Accident Compensation Commission claims rates for cycling and other activities. Michael Chieng, an Auckland medical student, found that the risk of a ACC claim was 35 times higher per rugby game than per two hour cycle ride, with cycling also safer than skiing and horseriding.  The health benefits of cycling are almost certainly greater than the risks, which is why helmet laws aren’t very good public health interventions.

It’s still a bit unfortunate that cycling was compared only to recreational activities, not to other ways of getting from point A to point B. I’m pretty sure that it’s less safe than walking or riding a bus. Also, unlike rugby and skiing, cycling in New Zealand is a lot more dangerous than it should be.

Sadly, I do have to point out, yet again, that there is not only no link to the research, there doesn’t even seem to be a source to link to.

February 2, 2014

Manipulating unemployment

There are two basic sets of numbers related to unemployment: the number of people receiving unemployment benefit, which is easy to measure because the government knows who they are and makes them check in regularly; and the actual number of unemployed people, which is harder to measure and not perfectly well-defined.

Essentially everyone in the world uses the same definition of the unemployment rate: number of people looking for jobs divided by number of people who have jobs or are looking.  This isn’t ideal — it excludes people who’ve given up looking for jobs because there aren’t any — but it’s standard (and endorsed by, eg, the International Labour Organisation).  These numbers are estimated in two ways: by a survey of people (in New Zealand, the Household Labour Force Survey) and by data from businesses (LEED, and the Quarterly Employment Survey, in New Zealand)

In countries such as NZ, with well-run, independent national statistics agencies, the unemployment rate is hard to manipulate because the official statisticians won’t let you. The number on benefits is hard to manipulate because it’s easily measured.  So both numbers are trustworthy measurements of what they measure.  Sometimes, deliberately or accidentally, people confuse the two and say that unemployment has gone down when in fact it’s only the number on benefits that has gone down. If anyone sees examples of deliberate or reckless confusion of numbers on benefits and numbers unemployed, I’d welcome a note either to me or as a Stat-of-the-Week nomination, since it’s an important issue and an easy target for a post.

The current government is not, actually, particularly culpable in confusing these numbers; they prefer to take unjustified credit for the economic improvements following the global recession. For example, Paula Bennett has tended to talk about her ministry’s success in reducing the number of people on benefits (whether it’s true or  not, and whether it’s good or not).

So, I was surprised to see a column by Matt McCarten in the Herald accusing the Government of manipulating the unemployment statistics. He doesn’t mean that Stats New Zealand’s unemployment rate estimates have been manipulated — if he had evidence of that, it would be (minor) international news, not a local opinion column. He doesn’t mean that the published numbers on people receiving unemployment benefits are wrong, either. In fact, none of his accusations are really about manipulating the statistics. Mr McCarten is actually accusing the government of trying to push people off unemployment benefits. Since that’s one of the things Paula Bennett has publicly claimed credit for, it can hardly be viewed as a secret.

Personally, I’m in agreement with him on his actual point, but not on how it’s presented. Firstly, if the problem is the harassment of unemployed people to stop them claiming unemployment benefits, you should say that, not talk about manipulating statistics. And secondly, if there really is widespread public misunderstanding when politicians talk about the state of the economy, it’s hard to see who could be more to blame than the Herald.

January 31, 2014

Briefly

  • Data journalism and computing. Scott Klein (Nieman Journalism Lab, Harvard): In 2014, you will be scooped by a reporter who knows how to program.  Alexander Howard (Tow Center for Digital Journalism Columbia) If you contrast his approach to commentators who make observations about Twitter without data or much experience, it’s easy to score one for the data journalist


  • Post hoc ergo propter hoc: When the Huffington Post writes about a lottery winner “Perhaps fortune cookies really can predict the future. Or at least William Johnson’s did” you know they don’t really mean you to take the claim seriously, so it isn’t really irresponsible. When Stuff writes, in what’s basically an ad for an alternative medicine book  `taking an alternative approach “was a gamble I was willing to take”, Jess says. It paid off,’ it’s less clear that they know this is bogus.  At least they do mention her mother tried the same thing (for a potentially-curable type of cancer) and died. For ‘balance’ read what a cancer surgeon says about this case.


  • There is no meaningful sense in which the recent fall in the Australian dollar affects the affordability of Auckland houses. The problem is bad enough without this sort of nonsense.