Posts written by Thomas Lumley (2645)

avatar

Thomas Lumley (@tslumley) is Professor of Biostatistics at the University of Auckland. His research interests include semiparametric models, survey sampling, statistical computing, foundations of statistics, and whatever methodological problems his medical collaborators come up with. He also blogs at Biased and Inefficient

December 11, 2013

Briefly

And these three men, Noah, Daniel, and Job were in it, and all the abominations that be done in (log n) steps.

December 9, 2013

Muphry’s Law

Muphry’s Law says that any attempt to criticise editing or proofreading will contain editing or proofreading errors. It clearly extends to criticising educational standards:

The biggest fall in NZ’s rankings was in mathematics, from 13th to 23rd (though we also fell from 7th to 18th in science and from seventh to 13th in reading).

(via @economissive)

Inequality in NZ

Nick Iversen nominated the Herald’s story on increasing inequality as Stat of the Week, on the grounds that it didn’t have any data showing increasing inequality. That’s slightly unfair — the increase in high incomes is not explainable by inflation — but it’s certainly true that the conclusion was pretty weakly supported by the numbers.

Firstly, any comparison of money in 2006 to money in 2013 that’s not inflation-adjusted in some way is pretty pointless. The CPI went up 19% over that period.

Secondly, minimum wages are pretty obviously relevant. At the last Census, the minimum wage was $9.50; at this Census it was $13.50, a nominal increase of 42% and a real increase of  19%.

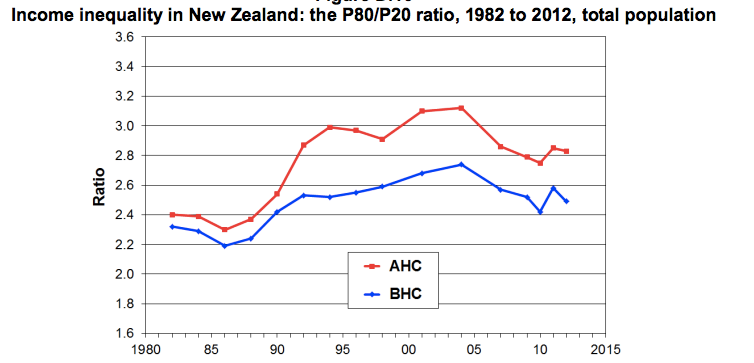
Thirdly, there are established ways to measure income inequality, and while they aren’t perfect, they are better than trying to reinvent the wheel.  From an Inequality Forum earlier this year,  we can find some summaries based on survey data (PDF) of the ratio of the 80th to 20th percentile of income, and the Gini index.  Here’s the 80:20 ratio, with the blue line for income before subtracting housing costs and the red line for income after subtracting housing costs. Both have gone down since 2006, though up since the 1980s, and housing costs are clearly a fair chunk of the inequality problem.

r8020


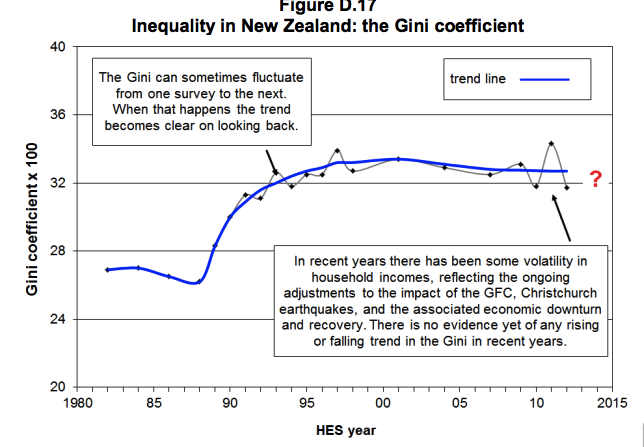
The Gini index is a more complicated summary of inequality that uses all the data, not just two percentiles. It’s popular for comparing between times and between countries.  The Gini index for raw income (before taxes and benefits) has stayed fairly stable in NZ recently.

gini


The Gini index for income after taxes and benefits will have increased, but probably not by a lot.

So, inequality in NZ is substantially higher than it used to be, and there are a lot of reasons to think this is bad, but the increase was in the 1980s and 1990s, not since 2006.  And this information is not hard to find.

December 2, 2013

Good graph/bad graph

  • The Herald has a nice display of how the percentage of first-home buyers varies across Auckland. I think (though the text could be clearer) that this is data since the start of 2012. I don’t know exactly how they define first-home buyers: quite a few immigrants, like me, will have been home owners outside NZ before buying a home here.
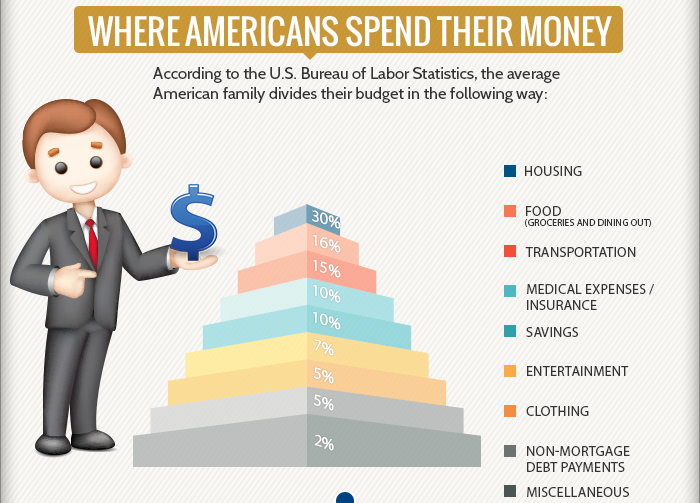
  • From wtfiz.net, originally a section of an infographic from graphs.net pyramid

To start with, the noseless guy doesn’t cast a shadow, although the almighty dollar he is holding casts a shadow on the empty air. Perhaps he’s a vampire. Also, the colours in the legend don’t actually match the colours in the graph. And, the graph manages to misrepresent not only the magnitude of the numbers but even their ordering, with the largest layer of the pyramid representing the smallest category.  To top it all off, the numbers aren’t even right (or are seriously outdated) — for example, the US Bureau of Labor Statistics Consumer Expenditure Survey reports food expenditure between 12.5% and 13% of  household expenditure every year from 2006 to 2012, not the 15% in the graph

Don’t be scared of WiFi

From TV One Breakfast this morning “WiFi detrimental to health, study suggests“. (I didn’t see this live; the Science Media Centre contacted me for comment)

The guest, Mr Kasper from Safe Wireless Technology NZ, said

Overseas research has shown that a person who uses a mobile phone for a year increases their chances of getting brain cancer by 70%, according to the SWTNZ.

The ‘overseas research’ appears to be this, a case-control study of acoustic neuroma in Scandinavia. The first thing to note is that “acoustic neuroma” isn’t the same thing as “brain cancer”. Acoustic neuroma is a rare, benign brain tumour (‘benign’ means it doesn’t spread metastatically), which is usually treatable, though often with long-term effects.  The researchers didn’t suggest that their results applied to other brain tumours; in fact, they assumed the opposite and used people with a different brain tumour, meningioma, as one set of controls for their comparisons.

The story  also says

“There’s so much research and there’s so much scientific evidence now that does more than just suggest that there is a real problem, and people are getting these problems,” Mr Kasper said.

The National Cancer Institute has a good summary of the scientific evidence, and they are not at all convinced. It certainly isn’t the case that there’s a strong association with brain cancer overall.

The new research appears to be better conducted than a lot of the past claims of associations between radio waves and health. It’s working against a strong burden of proof both from animal studies and from the fact that radio waves can’t damage DNA. I don’t think it manages that level of proof, but I think reasonable people could disagree. However, even if we assume that the association specifically with acoustic neuroma is real and causal, it doesn’t really support any concern over WiFi. Cellphones are pressed up against the ear, and so provide higher dose of radio-frequency energy to that ear. WiFi transmitters are typically not pressed up against the ear, and each doubling of the distance reduces the energy by a factor of four. And, since they don’t have to reach as far, WiFi signals are less powerful to begin with.

The story ends with

“We do want the Government to put some money into some independent research.”

I’m generally in favour of the Government putting money into research, but on this particular topic  there’s no real advantage to the research being done in New Zealand, and we have too small a population to contribute much. There are large international studies ongoing; we don’t need a small local one.

If you are worried about cellphones and acoustic neuroma, use headphones with your cellphone. If you are worried about WiFi and brain cancer, then relax.

 

November 29, 2013

Roundup retraction

I’ve written before about the Seralini research that involved feeding glyphosate and GM corn to rats. Now, Retraction Watch is reporting that the paper will be retracted.

This is a slightly unusual retraction: typically either the scientist has a horrible realisation that something went wrong (maybe their filters were affecting composition of their media) or the journal has a horrible realisation that something went wrong (maybe the images were Photoshopped or the patients didn’t actually exist).

The Seralini paper, though, is being retracted for being kinda pointless. The editors emphasise that they are not suggesting fraud, and write

A more in-depth look at the raw data revealed that no definitive conclusions can be reached with this small sample size regarding the role of either NK603 or glyphosate in regards to overall mortality or tumor incidence. Given the known high incidence of tumors in the Sprague-Dawley rat, normal variability cannot be excluded as the cause of the higher mortality and incidence observed in the treated groups.

Ultimately, the results presented (while not incorrect) are inconclusive, and therefore do not reach the threshold of publication for Food and Chemical Toxicology. 

They’re certainly right about that, but this is hardly a new finding. I’m not really happy about retraction of papers when it isn’t based on new information that wasn’t easily available at the time of review. Too many pointless and likely wrong papers are published, but this one is being retracted for being pointless, likely wrong, and controversial.


[Update: mass enthusiasm for the retraction is summarised by Peter Griffin]

Boris: not good enough

The Mayor of London, Boris Johnson, on equality:

‘It is surely relevant to a conversation about equality that as many as 16 per cent of our species have an IQ below 85,’ before facetiously asking the audience if anyone had a low IQ.

Now, there are lots of problems with the over-intepretation of IQ as a predictor of economic success.  There are problems with the definition of IQ from factor analysis: positive correlations between test results will lead to an apparent single factor explaining them, even when this about as untrue as possible.

But that’s not the most egregious statistical point. IQ, because it’s a hypothetical reconstruction, not a directly measured thing, doesn’t have any intrinsic values.  When you design tests to estimate intelligence, you can choose to scale the mean and spread of the distribution to be whatever you like. The people who designed IQ chose to set the mean at 100 and the standard deviation at 15.  That doesn’t tell you anything about how variable intelligence is between people, it’s just a choice of scaling, part of the definition of IQ.

Boris’s observation that 16% of people have an IQ below 85, then, is absolutely content-free. It’s like saying our schools are bad because 50% are below the median, or that NZ rugby teams aren’t very good because only one of them holds the Ranfurly Shield. The fact that more than 1 in 7 people is below the 16th percentile is, actually, not at all relevant to a conversation about equality.

November 28, 2013

More genetic misrepresentation

The Daily Mail strikes again, in today’s Herald story headlined “Gene explains why girls like sweet stuff more than boys”

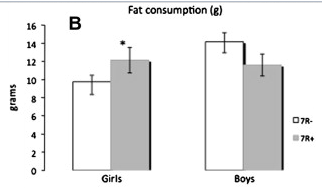
The actual research did an experiment to look at differences in what snacks children chose. The difference they found was in fat consumption, not sugar, and, overall, girls actually ate a bit less than boys, not more. Here’s the graph from the paper

sweet

The potentially interesting finding was that the difference between kids with two versions of the gene was larger for girls than boys, suggesting that the gene may act differently in boys and girls.

November 27, 2013

Interpretive tips for understanding science

From David Spiegelhalter, William Sutherland, and Mark Burgman, twenty (mostly statistical) tips for interpreting scientific findings

To this end, we suggest 20 concepts that should be part of the education of civil servants, politicians, policy advisers and journalists — and anyone else who may have to interact with science or scientists. Politicians with a healthy scepticism of scientific advocates might simply prefer to arm themselves with this critical set of knowledge.

A few of the tips, without their detailed explication:

  • Differences and chance cause variation
  • No measurement is exact
  • Bigger is usually better for sample size
  • Controls are important
  • Beware the base-rate fallacy
  • Feelings influence risk perception

Overselling genetics

From the Herald, under the headline “Could you have the binge drinking gene?

It’s long been known that a penchant for alcohol may be in the genes, and scientists say they may now be a step closer to understanding why.

They have found that a faulty gene may cause binge drinking – and that mice with the mutation overwhelmingly prefer the taste of alcohol to water.

This story is from the Daily Mail again; the Herald’s own reporters write better medical science stories.

In fact, the research is looking at mice to see the effect of mutating one of the genes encoding something called the GABA-A receptor. There’s some genetic evidence that differences in this gene are related to alcohol dependence (not binge drinking, which isn’t the same thing) in humans, and the researchers are interested in how the effect might work. They say

Our understanding of the genetic and molecular basis of alcohol dependence is incomplete. Alcohol abuse has long been associated with facilitation of neurotransmission mediated by the brain’s major inhibitory transmitter, GABA, acting via GABAA receptors (GABAARs). Recently, a locus within human chromosome 4, containing GABAAR subunit genes… associated with alcohol dependence in humans. … However, the neurobiological basis by which genetic variation translates into alcohol abuse is largely unknown.

This research into how the genetic differences might work is interesting and has potential applications in treatments for addiction, but we know that variants in this particular gene predict almost nothing about alcohol dependence in humans. That’s typical in modern large-scale genetics: genetic variants common enough to study in large numbers of people usually have very small effects, and they are important because they provide tiny points of light illuminating the complex biological mechanisms of health and disease.

You can get another useful bit of context by searching on “binge drinking gene”

  • Daily Mail, March 2011: It has long been believed that alcoholism runs in the family – now scientists have pinpointed why. They have identified a binge-drinking gene, offering new hope in combating the growing social problem, it was revealed today.
  • Daily Mail, December 2012:  A newly discovered addiction gene could be fuelling teenage binge-drinking, research suggests. The mutant version of the RASGRF2 gene makes the brain more sensitive to habit-forming rewards such as alcohol, studies have shown.

We were clearly due for identifying the binge drinking gene again about now. But if you want to know if you are at risk of binge drinking, counting your drinks will be much more informative than measuring your genes.