Posts written by Thomas Lumley (2645)

avatar

Thomas Lumley (@tslumley) is Professor of Biostatistics at the University of Auckland. His research interests include semiparametric models, survey sampling, statistical computing, foundations of statistics, and whatever methodological problems his medical collaborators come up with. He also blogs at Biased and Inefficient

October 30, 2013

Death or cake?

The Herald tells us

Most women are more scared of public speaking than they are of death, it has been revealed.

Researchers who polled 2,000 women found many are far more at ease with meeting their maker than they are of standing in a room talking to an audience hanging on their every word

On the other hand experience in  teaching suggests that a fairly large fraction of women would, given the choice, prefer public speaking to failing a university course.  

Since this is a survey commissioned by a London tourist attraction, and they aren’t providing any information about the survey methods, it’s hard to tell why the results are the way they are. All we can really tell is that it’s the sort of research where asking if the results are true is missing the point.

Briefly

  • The Legatum Prosperity Index ranks countries on a range of domains including economy, health, governance, social capital.  In their 2013 report NZ comes in 5th, and the top country in the Asia/Pacific.   Apparently, about a quarter of Kiwis believe there is widespread business or government corruption, and this is less than the figure almost everywhere else (Denmark is the exception)
  • A post on risk communication in the recent UK storm, from Ross Anderson, a computer security expert.
  • I have heard people comparing the UK storm to the recent Wellington storm, which didn’t cause any deaths despite stronger winds. Note that the UK storm killed roughly  one in twenty million of the UK population. In Wellington the same mortality rate would be about 0.01 people.
  • The Herald tells us Texting, reading magazines, eating and applying makeup are among the top 10 driver distractions, an AA Insurance survey has found.”  Looking at the press release, AA asked about twelve distractions. Eleven of them ended up in the top ten, so the list can’t be very sensitive to respondent opinion. 

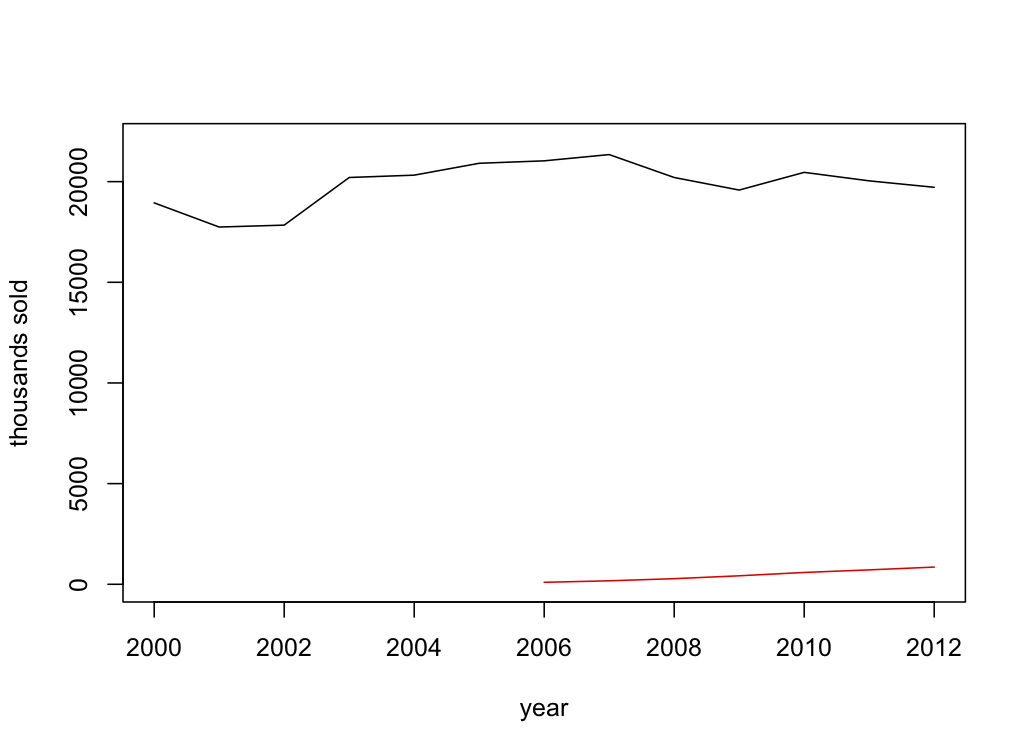
Evils of axis

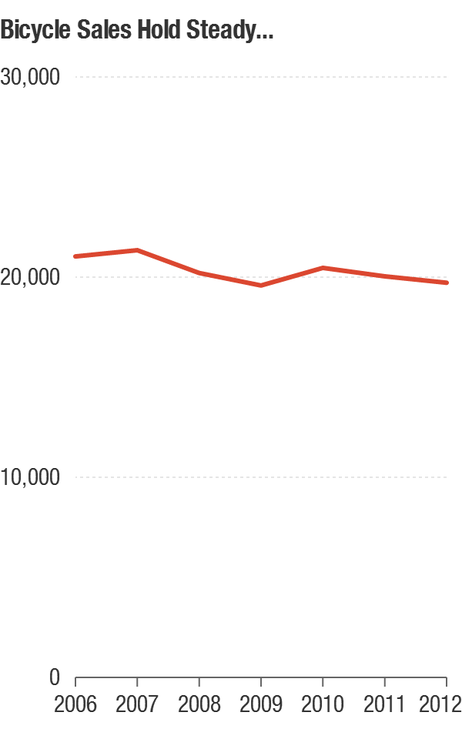
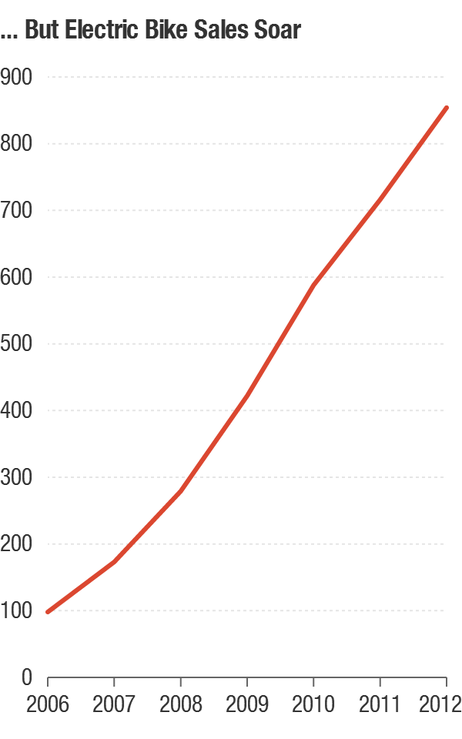
From NPR News, a story on the rise of electric bikes. With some unfortunate graphs.

bikeebike


Or, on the same axes

bikes

October 29, 2013

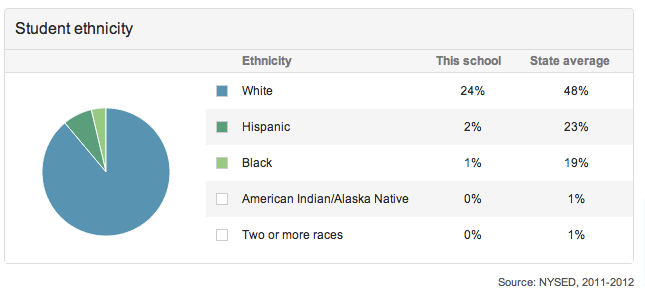
Pie chart of the week

whitepieFrom “Great Schools”, a US website with information about schools, via wtfviz.net

Significant bacon

Q: The Herald says  Bacon makes everything better – research“. What research is this?

A: Wired magazine and the Food Network did a simple analysis of recipe ratings, comparing recipes for roughly the same thing with and without bacon (and a similar analysis for some other ingredients). For example, they compared sandwiches with bacon to sandwiches without bacon.

Q: And did bacon make everything better, like the headline says?

A: No.

Q: Ok, did it make nearly everything better?

A: No.

Q: Lots of things?

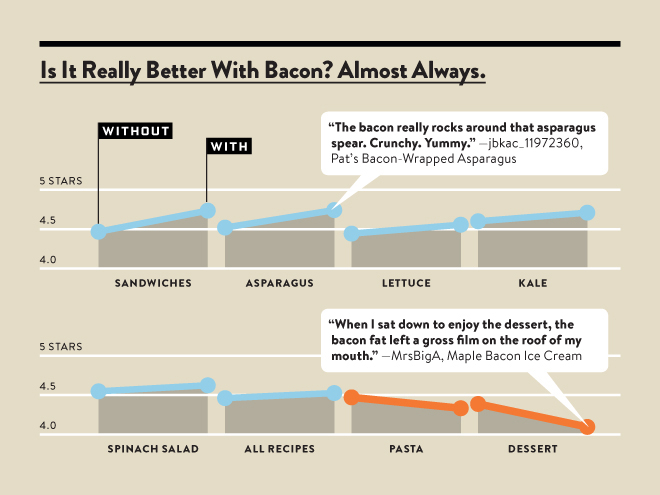
A: Yes. Though not necessarily by very much. Here’s the results. The biggest improvement is about 0.2 points on a 5-point scale.
bacon


Q: Are there actual numbers given somewhere, or results of other comparisons of ingredients?

A: No.

Q: These eight groups look a bit strange: kale vs all pasta dishes, for example. Did they look at other groups?

A: They might well have, but they aren’t telling.

Q: Do they explain why bacon is so good?

A: The Herald has an explanation (in fact, they have it twice, so it must be good). It’s the Maillard reaction

Q: Is that something that’s unique about bacon, which would explain why it’s different from other ingredients.

A: No. It’s in a huge range of foods.

Q: Is this sort of thing the future of data journalism?

A: Well, Wired says “Food is so personal and subjective that we’re always talking about it in vague and imprecise ways. But one of the many amazing things you can do with big-ish data is give precise questions to answers that always seemed so subjective.

Q: Is that as bogus as it sounds?

A: Yes. For example, this is a sample where the average kale dish is rated  more highly than the average dessert. Generalisable and objective food preference ratings are not what we’re looking at.

Q: Does this story, perhaps, come from the Daily Mail?

A: Why, yes. Complete with the misspelling of sriracha.

October 28, 2013

Some long reads

October 27, 2013

Fast-food outlets and obesity

Everyone knows that areas with more fast-food stores have more overweight people, and it certainly makes sense that fast food is bad for you. Like almost everything else, though, it gets more complicated when you start looking carefully.

Firstly, earlier this year Eric Crampton wrote in NBR about some research by an economics PhD student, Rachel Webb, who was trying to take advantage of this well-known relationship to unpick some aspects of correlation vs causation in the relationship between mother’s weight and infant’s birthweight. She found that, actually, areas in New Zealand with more fast-food outlets didn’t have more obesity to any useful and consistent extent.

Secondly, there’s new research on diet and fast food using data from the big NHANES surveys in the USA.  It confirms, as you might expect, that people who eat more fast food also eat less healthily at other times.


What you do know that ain’t so

In 2006, statistics celebrity Hans Rosling asked students at the Karolinska Insitute about international child mortality. In each of the following pairs of countries (presented in alphabetical order within pairs), which one has higher child mortality?

  • Sri Lanka or Turkey?
  • Poland or South Korea?
  • Malaysia or Russia?
  • Pakistan or Vietnam?
  • South Africa or Thailand

None of these are close — they differ by at least a factor of two — but the students did significantly worse than chance, averaging less than two correct answers out of five.

Gapminder.org has a new ‘Ignorance Project’ aiming to find out what important facts about global health and welfare are widely misunderstood.  They don’t just have a naive ‘information deficiency’ view of this ignorance:

When we encounter ignorance, we want to find a cure. Sometimes the facts just have to be delivered. But in many cases, the facts are little known as they don’t fit with other misunderstandings, they are counterintuitive, such as the most of the outdated concepts about the world population. In these cases we need to invent a new simple way to explain it. Those new explanations are the essence of Gapminder’s new free teaching material that make it fun and easy to teach and to learn a fact-based worldview.

It may not work, but it’s worth a try

(more…)

One in ten?

From Stuff, under the headline ‘One in 10 Kiwis now alcoholic

One in 10 New Zealanders could now be considered “alcoholic” according to new diagnostic criteria – but the majority of those with a drinking problem are unlikely to recognise it because the issue is so common.

The new estimate of 400,000 “alcoholics” in New Zealand – around 10 per cent of our 4.4 million population – was tallied up by Professor Doug Sellman from the National Addiction Centre at the University of Otago.

It is significantly higher than the Ministry of Health’s 2006 estimate which says 3 to 6 per cent of the population has an alcohol issue.

Sellman’s figures are based on the new diagnostic criteria for “alcohol use disorder” recently published in the fifth edition of the Diagnostic and Statistical Manual (DSM) of the American Psychiatric Association.

From the president of the American Society for Addiction Medicine, in a review of DSM-V

DSM-5 has “Alcohol Use Disorder,” which comes in mild, moderate and severe flavors, suggesting the inadequate pyramid approach. There are 11 possible symptoms of the “use disorder,” of which two are necessary to achieve a mild specifier, four for moderate and six for severe. “Alcohol use disorder is defined by a cluster of behavioral and physical symptoms,” the authors of DSM-5 state. I have no problem with that except that some may confuse “alcohol use disorder” with addictive disease or with alcoholism

Some may, indeed.

October 25, 2013

A third of young Americans have been arrested

Via Keith Humphreys, being arrested is a very common experience for young people in America: using the National Longitudinal Survey of Youth, Richard Braeme and colleagues found

By age 18, the in-sample cumulative arrest prevalence rate lies between 15.9% and 26.8%; at age 23, it lies between 25.3% and 41.4%. These bounds make no assumptions at all about missing cases. If we assume that the missing cases are at least as likely to have been arrested as the observed cases, the in-sample age-23 prevalence rate must lie between 30.2% and 41.4%. The greatest growth in the cumulative prevalence of arrest occurs during late adolescence and the period of early or emerging adulthood