Posts written by Thomas Lumley (2645)

avatar

Thomas Lumley (@tslumley) is Professor of Biostatistics at the University of Auckland. His research interests include semiparametric models, survey sampling, statistical computing, foundations of statistics, and whatever methodological problems his medical collaborators come up with. He also blogs at Biased and Inefficient

October 25, 2013

Briefly

October 24, 2013

Burning issue

I’m in Sydney at the moment, so this is topical, as well as being an illustration of maps, infographics, and internet fact-checking.

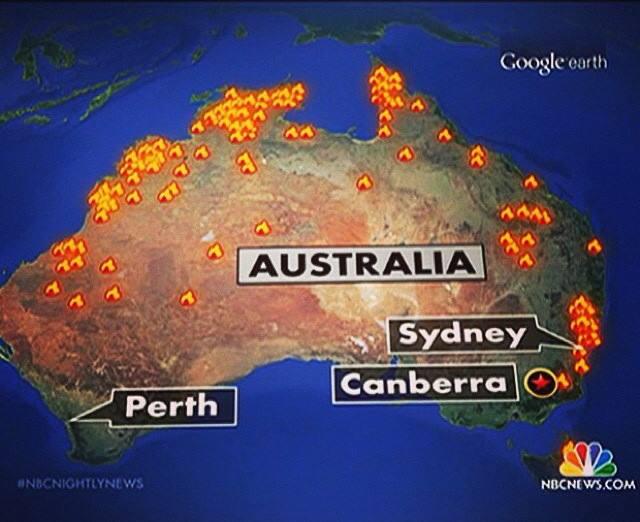
From Paul Rosenzweig on Twitter, allegedly a map of the bushfires shown on NBC News in the US

attributed to NBC News

People in Australia think this map is hilarious/outrageous depending on personality — the current emergency was just in New South Wales.  That was my reaction too. But the NBC News blog gets this right, which is a bit confusing

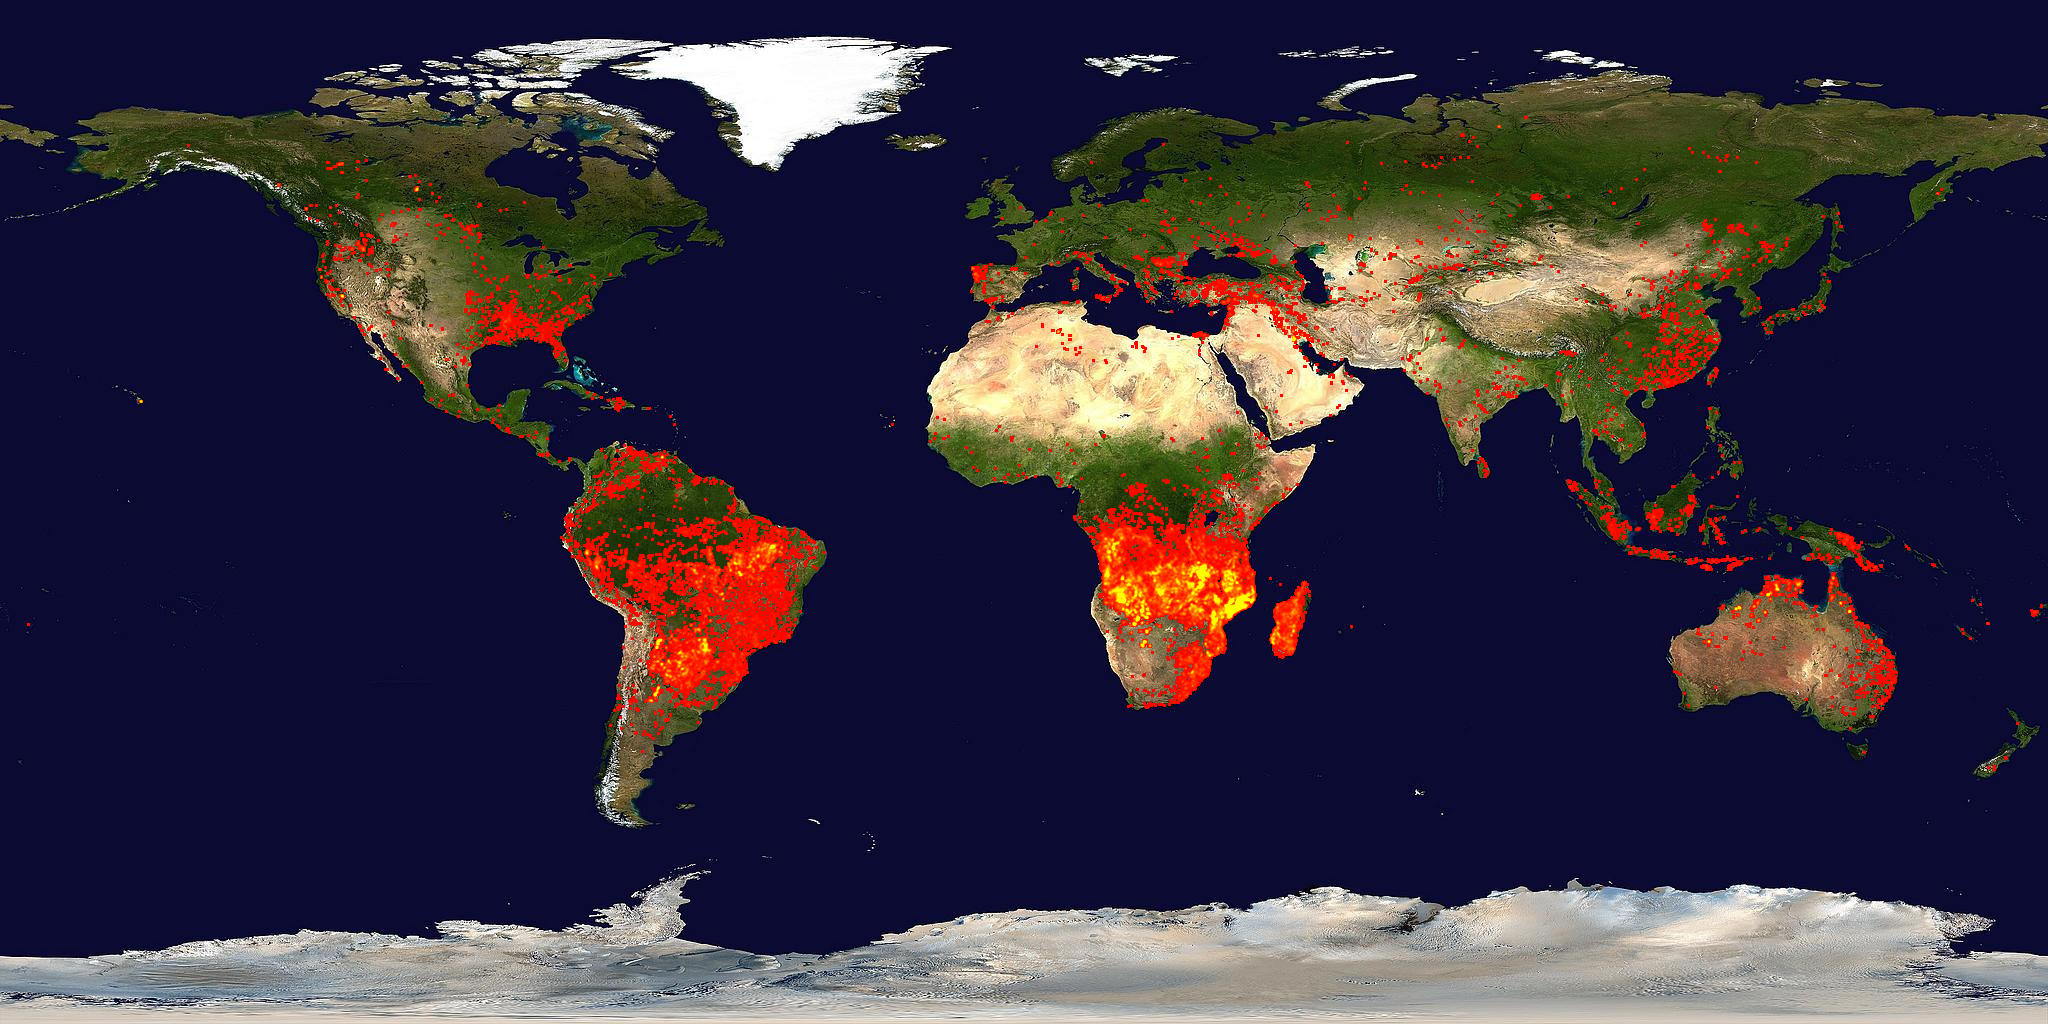
However, @Aus_ScienceWeek, the people who run National Science Week, point out that the map looks rather like the appropriate subsection of NASA’s satellite-based fire map from mid-September

firemap.2013251-2013260.2048x1024


so it might well be correct in the sense that there actually fires in those places, though still wrong as a description of the emergency.


October 22, 2013

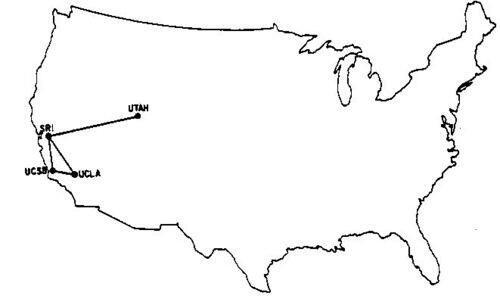
Historical infographics

A detailed map of the entire internet, the year I was born

BXIPZhIIAAIG0gM


And now

(via Michael MacAskill)

Surprises in data

What’s wrong with this sentence? (source)

The people we meet on the other star system are humans who were collected from Earth a hundred thousand years ago, and hence are virtually identical with us.

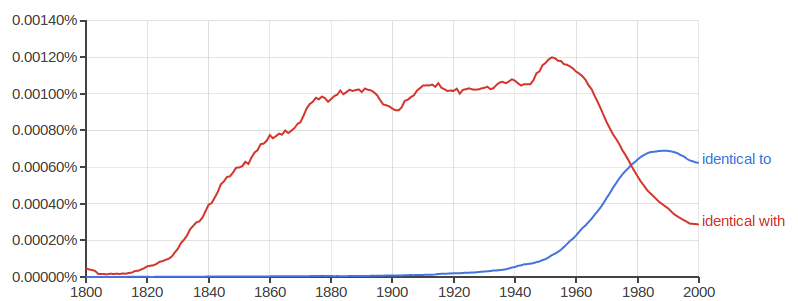
Many people would correct ‘identical with us’ to ‘identical to us’. Some people would argue that ‘identical with’ is not merely unconventional, but wrong for good reasons.

From Language Log, this is an example of linguistic change in process

identicalto_with


Until relatively recently, “identical with” was overwhelmingly the standard way to write. Now it isn’t. That’s not surprising. What’s surprising is that we mostly don’t notice the change, and often don’t notice how arbitrary these standards are.


Cookies not as addictive as cocaine

Sometimes a scientific claim is obviously unreasonable, like when a physicist tells you “No, really, the same electron goes through both slots in this barrier”. You’re all “Wut? No. Can’t be.” They show you the interference pattern. “But did you think of…?” “Yes”. “Couldn’t it be..” “No, we tried that.” “But…”  “And that.”  “Still, what about…?” “That too.” Eventually you give up and accept that the universe is weird. An electron really can go through two holes at once.

On the other hand, sometimes the claim isn’t backed up that well, like when Stuff tells us “Cookies as addictive as cocaine”. For example, while some rats were given Oreo cookies and others were given cocaine, there weren’t any rates who were offered both, so there wasn’t any direct evaluation of preference, let alone of addiction. The cookies weren’t even compared to the same control as the cocaine — cookies were compared to rice cakes, and cocaine-laced water to plain water.

There’s a more detailed take-down on the Guardian site, by an addiction researcher.

October 20, 2013

Medical Research Ethics

There’s a new edition of the Declaration of Helsinki, the research ethics declaration of the World Medical Association (diffs from the previous version)

Some of the main changes

  • Clarification of the principles for research on vulnerable populations, such as developing countries: the question should be relevant to them so that the answer provides benefits to them, and there should be a fair level of other benefits.
  • Explicit recognition that risks need to be monitored during the research
  • Requiring some way for the treatment identified as best to be available to research participants after a trial
  • Adding research sponsors (eg, drug companies) to the list of those with explicit obligations to ensure publication of all results.

(via Alice Dreger and Janet Stemwedel)

Infographics old and new

  • Abraham Lincoln’s “slave map”, via the New Yorker
  • The UK Data Explorer. Interactive graphics for UK official data, by James Trimble, who is a computing science student at Glasgow University
  • GED VIZ, from the Global Economic Dynamics project in Germany.
October 19, 2013

Briefly

  • Nature, the well-known science journal, has a new ‘Nature Graphics‘ tumblr with art, infographics, and some actual graphics with information.
  • The Herald reports the WHO has listed outdoor air pollution as a leading cause of cancer. They don’t point out that air pollution is going down in most of New Zealand.
  • The Herald also has an interesting report of someone getting a deep-vein thrombosis after a long gaming session. Sitting still for long periods has been known to have this risk since WWII, when cases turned up in Britain in air-raid shelters, but the risk is small.  For long plane flights, the risk of death from a blood clot is about one in a million, but more than ten times that many will need hospital treatment.
October 18, 2013

Cost-effectivness and meningococcal vaccine

There’s a story in the Herald arguing for mass vaccination in NZ against group C meningococcal disease.  There’s a good case for the vaccination — it’s a really nasty disease and there aren’t any other good treatment or prevention approaches — but I don’t see how the cost-effectiveness claims in the story can be right.

Dr Gravatt is quoted as saying there would be zero net medical cost for the vaccination program

Dr Gravatt estimated the net cost of vaccinating children at 12 months and again at 18 years would be zero for each “quality-adjusted” year of life saved at a vaccine price of $25 to $40 per dose. The listed prices were around $43 to $87, but discounts would be likely in a bulk contract.

He refers to a British vaccine study — which one isn’t specified.  However, there are cost-effectiveness analyses of the whole British group C meningococcal vaccination program (they vaccinate against group C but not group B, the opposite of NZ).  One, from 2002, estimates  a cost per life year saved of £6259. The second, from 2006, considers a wider range of possible vaccination programs: for the one that’s most similar to what Dr Gravatt proposed it estimates net medical costs of £9082 per quality-adjusted life year, and for the cheapest one, £3653 £2760 (update)per quality-adjusted life year. And that’s assuming the vaccine costs only £12 per dose, and in a country where group C meningococcal disease was slightly more common than it is here.

Another way to look at it: there are about 60000 births per year in NZ, so after the initial catch-up phase we’d be paying for 120000 doses per year. Even at $25 per dose, that comes to $3 million per year. According to the Herald’s story there are about 25 cases per year, so for the vaccination to be cost-neutral even at this lowest suggested price, the average disease case would have to cost the healthcare system $120000. That’s more than ten times what the UK cost-effectiveness study estimated (roughly £4000) including both the immediate cost of treating the disease and the cost of treating the long-term effects.

The vaccine looks to be a lot more cost-effective than, say, the prostate cancer drug that Campbell Live was pushing last week, and because herd immunity is important for this disease, there’s a relatively stronger case for vaccinating everyone, but that would be because the cost is worth it, not because the cost is zero.

Updates, including a lot more technical detail:  (more…)

October 17, 2013

Truly, madly, deeply

The Herald has a story on extra-marital affairs (no, not that one), headlined “Men with deep voices sexier, but more likely to cheat – study

Scientists found that men with masculine, low-pitched voices are better at attracting women – at least those looking for short-term flings.

But the baritone bad boys were also seen as more likely to cheat and not viewed as marriage material.

When you track down the actual research and look at the paper

Women selected lower-pitched men’s voices as more attractive for a short-term relationship (t86 = 6.74, p < .001; M = .70, SD = .279), as more attractive for a long-term relationship (t86 = 5.66, p < .001, M = .67, SD = .277), and as more likely to cheat on their romantic partner (t86 = 5.64, p < .001, M = .68, SD = .298), on a proportion of trials that was significantly greater than chance.

So, firstly, the headline is completely unsupported by the research: there is no information about actual propensity to cheat, just about what women thought about the men based solely on voice recordings.  Second, men with lower-pitched voices were also seen as more attractive, not less attractive, for a long term relationship.

What the research found that’s at least somewhat related to the story is that the advantage of deep voices was smaller in the context of long-term than short-term relationships. The problem is that this sort of difference of differences is quite sensitive to how you summarise your data — a switch from differences to ratios, for example, can easily cause it to reverse.

The story was originally from the Daily Mail. Sex, like cancer, is one of the topics where the Mail is especially untrustworthy