Posts written by Thomas Lumley (2645)

avatar

Thomas Lumley (@tslumley) is Professor of Biostatistics at the University of Auckland. His research interests include semiparametric models, survey sampling, statistical computing, foundations of statistics, and whatever methodological problems his medical collaborators come up with. He also blogs at Biased and Inefficient

July 16, 2013

Briefly

Numbers have a magnitude as well as an order

Nathan Yau, at Flowing Data, shows this barchart-like object

Speaking-the-world-625x622


The most obvious problem is that the bar for Chinese is about 3 times the area of the bar for English, and should be either about a third bigger, or, if you really believe there are 1 trillion Chinese speakers, 1300 times bigger. The bars for English and Spanish are obviously out of proportion as well.

I tried to find the original source of this graph, which Nathan doesn’t give, perhaps because he couldn’t find it either.  However, Google image search did show a related graph that explains some of the problems.  I found it at a range of sites, but the one at 10-most.com is where it looks most original.

The-most-common-languages


This version is still ugly, but the bars match the labels.

Comparing the numbers to Wikipedia, it looks as though someone edited the labels from ‘top ten by number of native speakers’ to ‘top ten by total number of speakers’ either as a deliberate change or because they didn’t understand the original graph (and they also inflated the Chinese count by a factor of 1000). Sadly, the editor didn’t appreciate that the bars are more than just decoration; they are supposed to convey numeric information.

PS: Yes, we could also get picky about ‘Chinese’ as a single language, but they clearly mean Mandarin Chinese, the group of dialects that includes the official language of both the PRC and the ROC.


July 15, 2013

Think of a number and multiply by eight

We haven’t had a good denominator post in a while, but I was struck by Stuff’s story on ‘social lending’.  By next April, an NZ company hopes to be able to start up peer-to-peer lending here, after changes in the law, and we’re told

“This will be a way for individuals to play alongside the big institutions,” Milsom said

Just how that can happen – and the scale that is possible – is shown from what has happened in the UK, where the largest peer-to-peer lender has lent more than £330 million since it launched in 2005.

That’s an average of just over £40 million per year over 2005-2012, or about 66p per capita per year in the UK.  On the same scale in New Zealand, that would come to perhaps $6 million per year in loans.  The UK lender in question appears to be Zopa, and they make their money by charging a 1% borrowing fee and 1% lending fee.  Under the same setup, $6 million per year in loans would mean $120 000 per year in income for an NZ equivalent, before paying any costs.

It’s certainty possible that peer-to-peer lending will take off, and it might not be long before it exceeds 1% of all unsecured consumer debt. But the idea makes more sense spun as ‘room for expansion’ not as ‘look at the scale in the UK’.

July 13, 2013

Visualising the Bechdel test

The Bechdel Test classifies movies according to whether they have two female characters, who at some point talk to each other, about something other than a man.

It’s not that all movies should pass the test — for example, a movie with a tight first-person viewpoint is unlikely to pass the test if the viewpoint character is male, and no-one’s saying such movies should not exist.  The point of the test is that surprisingly few movies pass it.

At Ten Chocolate Sundaes there’s an interesting statistical analysis of movies over time and by genre, looking at the proportion that pass the test.  The proportion seems to have gone down over time, though it’s been pretty stable in recent years.

July 12, 2013

Did he ever return?

Irene Ros has a visualisation of ridership on the Boston subway (famous from the Kingston Trio song back before I was born)

You can see how the rush-hour varies across the subway lines, with the Silver Line (to the airport) having only an evening rush hour, the Green line having a moderate morning peak,  the Red and Orange lines having about the same peak in the morning and evening, and the Blue line having more of a peak in the morning.


Is this a record?

In what may be the least accurate risk estimate ever published in a major newspaper, the Daily Mail said last week

  • Hormone replacement could cause meningioma in menopausal women
  • Those using HRT for a decade have a 70% chance of developing a tumour
  • Most are benign but 15% are malignant and all have damaging side effects

You don’t actually need to look up any statistics to know this is wrong, just ask yourself how many women you know who had brain surgery. Hormone replacement therapy was pretty common (until it was shown not to prevent heart disease), so if 70% of women who used it for a decade ended up with meningioma, you’d know, at a minimum, several women who had brain surgery for cancer.  Do you?

In fact, according to the British NHS, the lifetime risk of meningioma is about 0.07%. Since it’s more common in women, that might be as much as 0.1% lifetime risk for women. The research quoted by the Mail actually found a relative risk of 1.7, so the lifetime risk might be up to 0.17% in women who take a decade of hormone replacement therapy. That is, the story overestimates the risk by 69.8 percentage points, or a factor of more than 400.

While this may be a record so far, there’s still room for improvement, and I certainly wouldn’t bet on the record standing for ever.

(via @hildabast and @BoraZ on Twitter, and Paul Raeburn of the MIT science journalism program)

In real terms

From @LIVENewsDesk on Twitter, and then Stuff, we have record nominal prices for petrol.

Adjusted for inflation, the price is still definitely lower than in mid-2008, when it got to $2.18, which is $2.41 in today’s money, and driving is much cheaper than in was in the mid-1980s.

Also, neither Stuff nor the AA still seem to know about the government’s independent petrol-price monitoring system. Their estimate of the importer margin has been stable since May, but is well above recent historical levels.

July 11, 2013

It’s not as bad as you think

The Royal Statistical Society has just commissioned an opinion poll to look at beliefs about policy-relevant issues and how they relate to reality.  The first few results:

  1. Teenage pregnancy: on average, we think teenage pregnancy is 25 times higher than official estimates: we think that 15% of girls under16 get pregnant each year, when official figures suggest it is around 0.6%.
  2. Crime: 58% do not believe that crime is falling, when the Crime Survey for England and Wales shows that incidents of crime were 19% lower in 2012 than in 2006/07 and 53% lower than in 1995. 51% think violent crime is rising, when it has fallen from almost 2.5 million incidents in 2006/07 to under 2 million in 2012.
  3. Job-seekers allowance: 29% of people think we spend more on JSA than pensions, when in fact we spend 15 times more on pensions (£4.9bn vs £74.2bn).
  4. Benefit fraud: people estimate that 34 times more benefit money is claimed fraudulently than official estimates: the public think that £24 out of every £100 spent on benefits is claimed fraudulently, compared with official estimates of £0.70 per £100.

You might look up what the actual figures are in New Zealand. To get you started, Paula Bennett claimed about $200 million in benefit fraud in 2010/11 (and about 10% of that was prosecuted) from about $9 billion, or about 22c per $100.

July 9, 2013

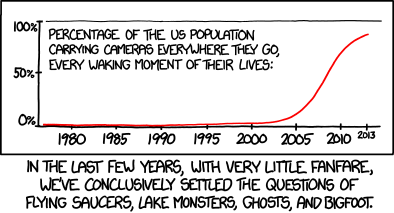
Sometimes absence of evidence is evidence of absence

From XKCD

July 8, 2013

Lost productivity: pick a number, any number

From Wonkblog at the Washington Post, a look at all the things that allegedly cost the US $BIGNUM in productivity, eg

– The fact that so many employees aren’t engaged with their jobs costs U.S. employers a staggering $550 billion per year.

– Parents stressed out about child care cost $300 billion per year in lost productivity.

– Cigarette smoking takes $92 billion per year out of the workplace.

– Then throw in insomnia, which costs another $63 billion per year.

– Let’s not forget excessive commuting, which costs employers $90 billion per year.

Adding up all of the losses gives $1.8 trillion per year. That’s about 12% of US GDP or about 2/3 of US federal government tax receipts.