Posts written by Thomas Lumley (2645)

avatar

Thomas Lumley (@tslumley) is Professor of Biostatistics at the University of Auckland. His research interests include semiparametric models, survey sampling, statistical computing, foundations of statistics, and whatever methodological problems his medical collaborators come up with. He also blogs at Biased and Inefficient

July 23, 2013

Legal high bans and crime

From Scoop, in a press release on the legal-highs bill by Manurewa Local Board member Toa Greening

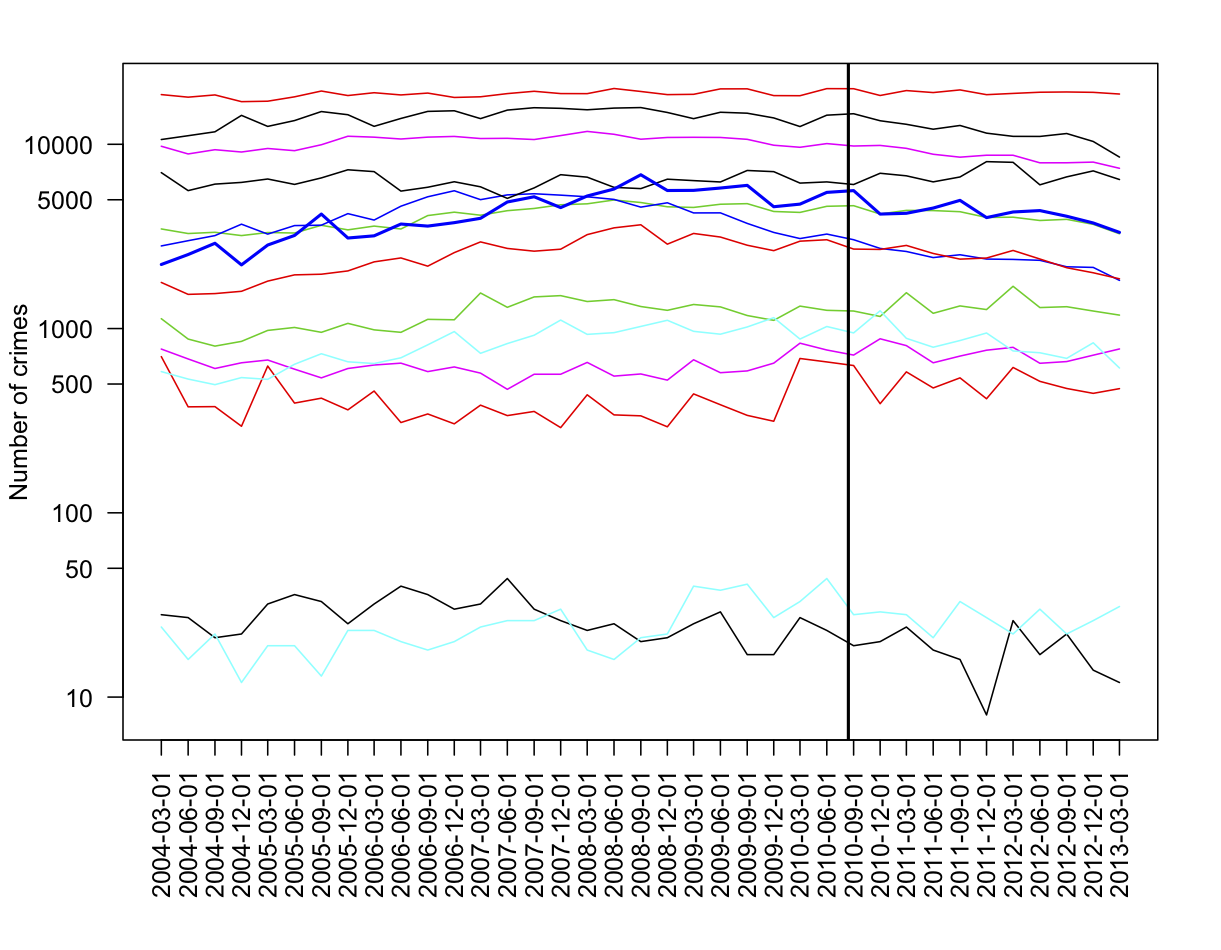
Ireland led the way by prohibiting all non-prescribed psychoactive substances back in 2010. This resulted in an immediate reduction in related psychoactive substance health issues and crime.

Irish data on recorded crimes is available throught the Ireland Official Statistics portal, Statcentral.ie.  This graph shows quarterly data since 2004 for the main crime categories (the heavy blue line is drug offenses, and the vertical line is when the ban came into force)

irish-crime


I don’t see any dramatic effects of the ban on any category of crime.

Research provenance (just link, already)

The Herald has a story about high rates of depression in young Australian men, which gives very little information about what the data was like and where it came from.  Often that’s a sign that the people who came up with the numbers would really prefer you not know how they did it.

In this case, though, the research is from a well-designed  survey with computer-based interviewing of people chosen by dialling random telephone numbers, and there’s a detailed description of the research program and a glossy but carefully-written and informative report (PDF) available.


When prediction is useless

We have seen before on StatsChat that, worldwide, there’s no relationship between the position of the moon and the risk of earthquakes.  Suppose, for the sake of argument, that there was some relationship in New Zealand.  Imagine that in Wellington, 100% of big earthquakes happened in the 24-hour period centered on the moon’s closest approach to the earth. The real figure is more like 0%, since Sunday’s earthquake missed the window by a few hours (perigee was 8:28am Monday) and the 1855 Wairarapa quake and the 1848 Marlborough quake missed by days, but we’re running a thought experiment here.  Would this level of prediction be useful?

At one or two big quakes per century, even if they all happened on a predictable day of the lunar month, that’s a risk of between 0.075% and 0.15% per month. At one extreme, you couldn’t evacuate Wellington every month to get around the risk (and even if you did, it would probably cause more injuries each month than happened in Sunday’s quake).  At the other extreme, you could make sure you had a few days supply of water and food, and a plan for communicating with friends and relatives, but that’s a good idea even in the real world where earthquakes are unpredictable.  The only thing I could think of is that you wouldn’t schedule major single-day tourist events (World Cup games, royal visits) or the most delicate pieces of construction work for that day.

[If you want to look up lunar distances, there’s a convenient online calculator. Note that the times are in UTC, so the NZ standard time is 12 hours later than given]

July 22, 2013

Recycling

The Herald has a story headlined “The high cost of shoplifting in NZ“, which is very similar to the story in Stuff in May that we commented on back then.

We get the figure for total theft from the Retailers Association again, with a similar lack of detail as to what it measures and how, but now without even the estimate of what proportion of it is shoplifting vs theft by staff that was provided in May.  Again there is a set of high-profile or high-value examples given, but now two of the five are from other countries.

The other change is that we now are told that prosecutions for shoplifting have fallen by 20-25% over the past four years, but there is no information on how this relates to the Retailers Association estimate — do they think theft has gone down, and if not, why not?

July 20, 2013

Briefly

July 18, 2013

Why don’t people know stuff?

There’s been a lot of discussion on the internet and in the UK media about  the Royal Statistical Society’s poll on widespread misbeliefs in the UK, which we covered about a week ago.

One useful response is from Alex Harrowell at The Yorkshire Ranter

The deficit model of ignorance defines ignorance to be a deficiency disease, in which individuals lack facts and are therefore prone to believing nonsense. Ignorant individuals know fewer facts than non-ignorant individuals. This is true as far as it goes. The problem arises when you try to determine causes or prescribe treatment. The deficit model leads to the conclusion that you should, somehow, give them fact pills. Once supplemented with facts, they’ll be OK.

The problem, though, is that this doesn’t actually work, and raises the question as to why they got like that.

July 17, 2013

Olympic and Paralympic success (per capita)

From Stats New Zealand

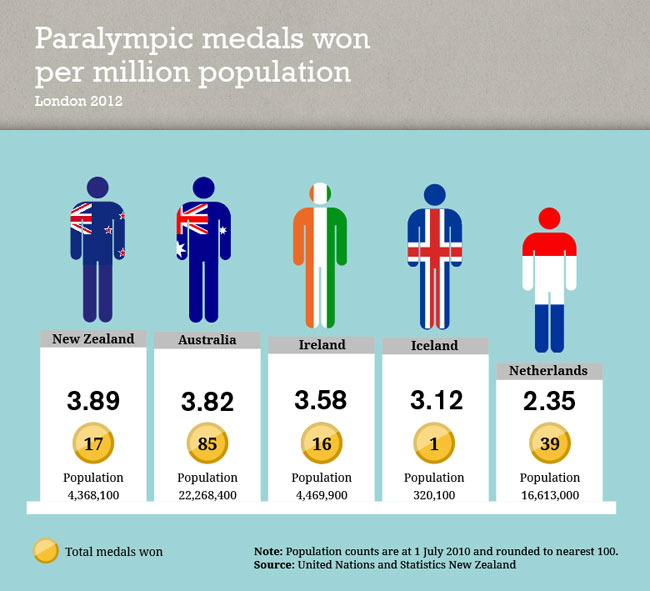
Paralympic medals per capita

yrbk12-paralympic


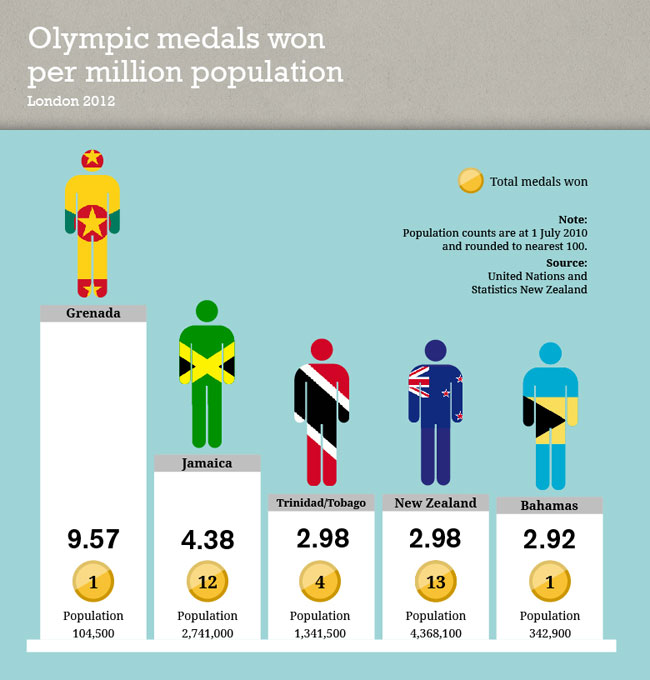
and (you’ve seen this before) Olympic medals per capita

yrbk12-olympic


Congratulations to the athletes.

This being StatsChat, I will note that it’s not obvious where the bars begin and end in these plots (is the white pedestal included? Is the grey top included? How about the flag-wrapped athlete?), and however I try to do it, the Grenada bar seems to measure less than twice the length of the Jamaica bar, which shouldn’t be the case.


Some data visualisation links

These are from a long list of recommended links at Health Intelligence (I wouldn’t recommend all of the long list).

July 16, 2013

Benefits numbers context

According to Stuff, Paula Bennett says the number on benefits is down by 10,000 since last year . Whether this is good or bad depends on where they ended up instead (as the story points out) but it is what the Government was attempting.

What the story doesn’t point out is that by MSD numbers there were drops of 10,000 or more in the number on benefits in the years ending June 2004, 2005, 2006, 2007 (and over 7000 in the year ending 2012, and over 8000 in the year ending 2003). And that’s as early as the data file goes.

Numbers on benefits have been going down for a long time, with an interruption for the recession, when they (obviously) went up a lot. Some of what we’re seeing now is just economic recovery, some is new rules, some is long-term changes in society. It’s hard to split the credit or blame, but it’s useful to know that a fall of 10,000 in a year isn’t  unusual.

If you hold a seashell to your ear

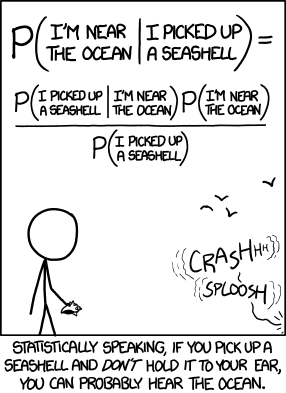
From XKCD and Bayes’ Theorem

seashell