Posts written by Thomas Lumley (2645)

avatar

Thomas Lumley (@tslumley) is Professor of Biostatistics at the University of Auckland. His research interests include semiparametric models, survey sampling, statistical computing, foundations of statistics, and whatever methodological problems his medical collaborators come up with. He also blogs at Biased and Inefficient

January 23, 2013

Where denominators don’t help

There’s a report saying that NZ smartphone users are the 7th most at risk for attacks by cybercriminals.  We could ask the usual questions about whether this survey is worth the paper it’s not written on, but this time those are left as an exercise for the reader [as is often the case, the last sentence of the Herald’s story is especially informative].

An unusual problem with the ranking is

The ranking was based on the percentage of Android apps rated as high-risk over the total number of apps scanned per country.

The use of a percentage rather than a total here seems to make no sense.  If you have a high-risk app on your phone, it doesn’t become low-risk just because you also have lots of other apps.

Biologists want more statistics

An article in Nature (not free access, unfortunately) by Australian molecular biologist David L. Vaux

 “Experimental biologists, their reviewers and their publishers must grasp basic statistics, or sloppy science will continue to grow.”

This doesn’t come as a surprise to statisticians, but it is nice to get the support from the biology side.  His recommendations are also familiar and welcome

How can the understanding and use of elementary statistics be improved? Young researchers need to be taught the practicalities of using statistics at the point at which they obtain the results of their very first experiments.

[Journals] should refuse to publish papers that contain fundamental errors, and readily publish corrections for published papers that fall short. This requires engaging reviewers who are statistically literate and editors who can verify the process. Numerical data should be made available either as part of the paper or as linked, computer-interpretable files so that readers can perform or confirm statistical analyses themselves.

Professor Vaux goes on to say

When William Strunk Jr, a professor of English, was faced with a flood of errors in spelling, grammar and English usage, he wrote a short, practical guide that became The Elements of Style(also known as Strunk and White). Perhaps experimental biologists need a similar booklet on statistics.

And here I have to quibble. Experimental biologists already have too many guides like Strunk & White, full of outdated prejudices and policies that the authors themselves would not follow.  What we need is a guide that lays out how good scientists and statisticians actually do handle common types of experiment (ie, evidence-based standard recipes), together with some education on the basic principles: contrasts, blocking, randomization, sources of variation, descriptions of uncertainty. And perhaps a few entertaining horror stories of Doing It Rong and the consequences.


January 22, 2013

The house always wins

The Herald has a good story about gambling: the total expenditure net of winnings is $2 billion/year, [update or $16billion gross] about $3600 per capita.  That’s quite a lot. For example, looking at the Retail Trade Survey, it’s about twice what we spend on alcohol, and about the same as expenditures on all recreational goods.

What’s harder to tell is how the expenditures break down across

It’s quite possible that the last category is a large fraction of total expenditure, while being a small fraction of total people.


[update: the $3600 figure includes winnings. Losses are a more plausible $450/capita]

January 21, 2013

Seasonal units of measurements

Stuff says (complete with cute photo)

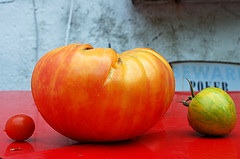
The birth of a rare Nepalese red panda baby, weighing not much more than a tomato, has thrilled Auckland Zoo keepers.

Hmm.

pandasize

Especially given all the fuss last year about New Zealanders’ ignorance of vegetables, perhaps “weighing a bit less than an iPhone” would be more informative.


Minus several million for good thinking

A monstrosity from The Globe & Mail (Canada)

Globe & Mail (via Dennis Cotes & Andrew Gelman)


Andrew Gelman demolishes it and suggests better ways to display the data.  His conclusion is interesting

But that’s part of the problem—the clearer graph would also be easier to make! To get a distinctive graph, there needs to be some degree of difficulty.

In other words, ten out of ten for style.

For the record

This weekend, Christchurch had its biggest aftershock for six months.  The moon was substantially further from the earth than average.

Journalist on science journalism

From Columbia Journalism Review (via Tony Cooper), a good long piece on science journalism by David H. Freedman (whom Google seems to confuse with statistician David A. Freedman)

What is a science journalist’s responsibility to openly question findings from highly credentialed scientists and trusted journals? There can only be one answer: The responsibility is large, and it clearly has been neglected. It’s not nearly enough to include in news reports the few mild qualifications attached to any study (“the study wasn’t large,” “the effect was modest,” “some subjects withdrew from the study partway through it”). Readers ought to be alerted, as a matter of course, to the fact that wrongness is embedded in the entire research system, and that few medical research findings ought to be considered completely reliable, regardless of the type of study, who conducted it, where it was published, or who says it’s a good study.

Worse still, health journalists are taking advantage of the wrongness problem. Presented with a range of conflicting findings for almost any interesting question, reporters are free to pick those that back up their preferred thesis—typically the exciting, controversial idea that their editors are counting on. When a reporter, for whatever reasons, wants to demonstrate that a particular type of diet works better than others—or that diets never work—there is a wealth of studies that will back him or her up, never mind all those other studies that have found exactly the opposite (or the studies can be mentioned, then explained away as “flawed”). For “balance,” just throw in a quote or two from a scientist whose opinion strays a bit from the thesis, then drown those quotes out with supportive quotes and more study findings.

I think the author is unduly negative about medical science — part of the problem is that published claims of associations are expected to have a fairly high false positive rate, and there’s not necessarily anything wrong with that as long as everyone understand the situation.  Lowering the false positive rate would either require much higher sample sizes or a much higher false  negative rate, and the coordination problems needed to get a sample size that will make the error rate low are prohibitive in most settings (with phase III clinical trials and modern genome-wide association studies as two partial exceptions).    It’s still true that most interesting or controversial findings about nutrition are wrong, and that journalists should know they are mostly wrong, and should write as if they know this.   Not reprinting Daily Mail stories would probably help, too.


January 20, 2013

Crime trends and marriage equality

[Update: according to today’s Herald, Mr McVicar wasn’t speaking for the Sensible Sentencing Trust.  That wasn’t clear from yesterday’s story.]

The Sensible Sentencing Trust, rather surprisingly given their goals, seem to have a view on same-sex marriage. As Stuff reports

Sensible Sentencing Trust leader Garth McVicar has submitted to Parliament that changing the law to allow same-sex marriage will be yet another erosion of basic morals and values in society which have led to an escalation of child abuse, domestic violence, and an ever-increasing prison population.

The story also quotes someone who knows what they are talking about

Criminologist Dr James Oleson, from Auckland University, an expert in deviance, said he was not familiar with any research that would suggest homosexuals would be responsible for a disproportionate amount of crime.

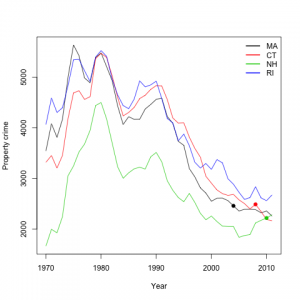
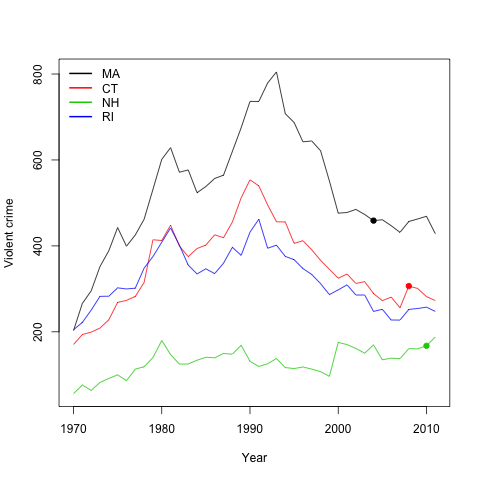
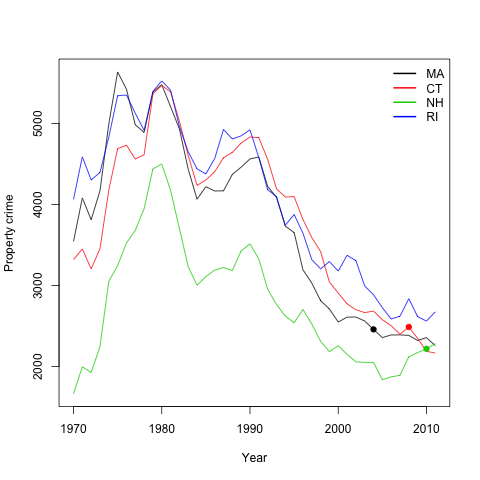
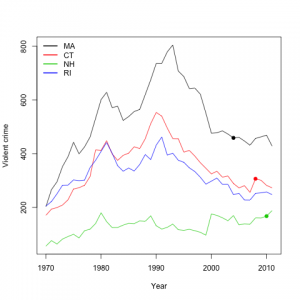
I thought it would be entertaining to look at data from the US, where several states have introduced marriage equality over the past several years.  I looked at states bordering Massachusetts, since it was the first, in 2004, Connecticut and New Hampshire followed a few years later.  Here are graphs of crimes per 100,000 population for these three states and for Rhode Island, which does not yet allow same-sex marriage.

First, violent crime.  The dot is the year that same-sex marriage started.
violent-crime


And property crime

prop-crime

See the upward trend after the dots? Me either.

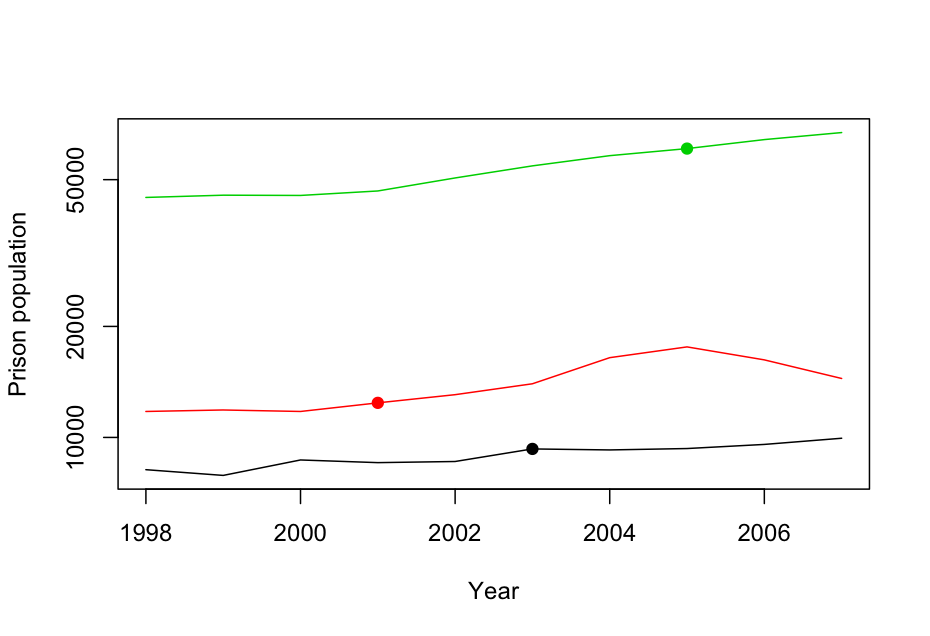
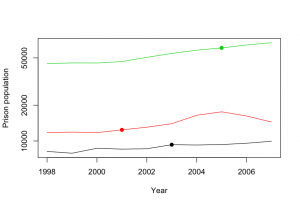
For Europe it was harder to find crime data, but Mr McVicar mentioned “an ever-increasing prison population”, and I did find 1998-2007 prison populations for European Union countries.  Here are the trends for the three that introduced same-sex marriage during that period: Netherlands (red), Belgium (black), and Spain (green).  Again, the dots are when marriage equality started. Looking at this graph, the phrase “robustly null” comes to mind.
europrison


I don’t know why Mr McVicar thinks he and other New Zealanders will lose their moral fibre and become hardened criminals if the marriage equality bill passes, but it doesn’t seem to have happened in other countries.

 

January 17, 2013

Melanoma apps

Stuff has a good story about a research study looking at smartphone apps for diagnosing melanoma.  These turn out not to be very accurate: they miss quite a lot of melanomas. The story doesn’t mention the false positives, but they are just as bad. Three of the four apps reported  more than 60% of non-melanomas as of concern, so you might as well just cut out the middleman and get checked properly from the start.

Nitpicking: the study was done at the University of Pittsburgh, which is in Pittsburgh, not in Chicago as Stuff seems to think.  Also, the name of the journal isn’t “Online First”, it’s JAMA Dermatology.

Up-Goer Five biostatistics edition

Inspired by the XKCD cartoon describing the Saturn V rocket (US Space Team’s Up Goer Five) using only the 1000 most common words in English, people are now writing descriptions of their jobs.   Here’s mine:

I work with doctors who study how to avoid people being sick, especially in their hearts. It is easy to confuse different reasons for being sick, and I use numbers to help the doctors understand if the real cause is what they guess. I also study how to decide what numbers to get and from how many people, so that we can be sure, but not use too much money or time. I need to use a computer because there are lots of numbers to study, and I write stuff so the computer can help other people plan and use numbers to find things out. 

Also, there are lots of cool jobs for people who use numbers to help people find things out, so lots of students want to learn how. At my school, we (try to) help them learn.

This description has been brought to you by “the year for people all over the world to talk about using numbers to find things out”.

[Update: there’s a Storify list of these taken from Twitter. We’re on it thanks to Brendon’s tweet]