January 9, 2013
Ask Nate Silver anything
Nate Silver is doing a Q &A session at reddit.com (they have a running feature I am A …. ask me anything)

Thomas Lumley (@tslumley) is Professor of Biostatistics at the University of Auckland. His research interests include semiparametric models, survey sampling, statistical computing, foundations of statistics, and whatever methodological problems his medical collaborators come up with. He also blogs at Biased and Inefficient
Nate Silver is doing a Q &A session at reddit.com (they have a running feature I am A …. ask me anything)
The graph shows letter frequencies in English by position in the word — for example, ‘e’ is much less common as the first letter than as the third letter.
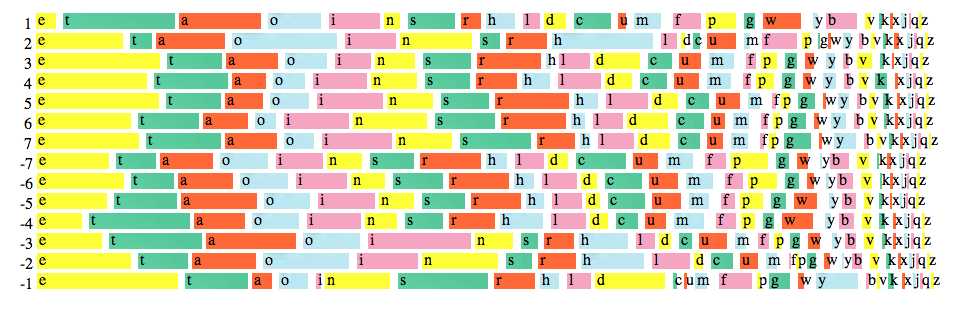
The first systematic study of these was done using a sample of 20 000 words collected by hand and analysed with punched cards and a card-sorting machine. The author recently wrote to Peter Norvig, at Google, suggesting that an update might be of interest. The full details, using 0.75 trillion words, are on Norvig’s web page.
While you’re there, if you have yet to encounter the “Gettysburg Powerpoint”, now is your opportunity.
Most ‘3-dimensional’ graphics that you see are using fake perspective and don’t actually provide much additional information. The Australian Bureau of Meteorology maximum temperature forecasts are a genuine 3-d data display, illustrating that you really, really don’t want to be in eastern central Australia this week. Notice how the coolest parts of Australia are the same temperature as here.

The purple colour at the top of the scale doesn’t fit in well with the rest of the spectrum, and stands out on the map. Normally this would a bad thing, but 50C deserves to stand out.
Stuff has a story about genetic testing today, which leads off
Those sending their DNA to be analysed cheaply overseas are obliged to share the results with life insurers and risk losing control of their most sensitive information.
If you read further, it turns out that all the information about insurance and law is Australian.
In October, they had a similar story, with information on the relevant US law.
The Herald has a story about police being arrested: 67 over 2 2/3 years. That’s about 25 per year. The rate this year so far is a bit lower than in the previous two years, but well within the margin of error.
The Police Association says this proves we don’t need an independent complaints process, since the police already do a good job in catching their own when they stray. Of course, the figures don’t show anything of the sort, unless there is some independent reason to believe that 25/year is the number that should be arrested. The Police Association also says that many of the arrests would have ‘not guilty’ results. This could be true, and it’s a pity that neither the Herald nor the Police Association provided any actual information on convictions.
The Herald also quotes a survey from October, purporting to show that confidence in police has fallen. I covered this at the time. It doesn’t.
The arrest counts are not evidence one way or the other on how well the police are policed. They are easier to obtain than relevant evidence would be, but that’s not much consolation.
StatsChat goes on and on about the need to compare numbers: if you have two polls of the same question, you should probably compute either an average or a difference.
It could be seen as positive, then, that the Herald is reporting changes in attitudes to Aucklanders, with the headline “Poll finds rest of NZ warming to Jafas”
A recent Herald on Sunday-commissioned poll found around 45 per cent believed Aucklanders held themselves in higher regard than other New Zealanders.
Unfortunately, if you just have one poll, as the Herald does, taking differences becomes more difficult. They have to fall back on an opinion (from a tourism manager at Ateed)
“If you had conducted a poll like that 15-20 years ago the numbers would have been a lot higher.
“Attitudes towards Auckland are changing and more people from outside Auckland are choosing to live here.”
Sounds plausible, and I assume he knows what he’s talking about, but it would have worked just as well without the poll.
Also, if you’re going to ask people about attitudes towards Aucklanders, who make up about 1/3 of the population, it really matters whether Aucklanders are included in the sample or not. At least, it would if the poll results mattered for the story. The Herald doesn’t say.
Stuff (The Sunday Star-Times) has a story about taser use statistics that illustrates the importance of the question ‘compared to what?’.
The paper tells us that nearly 1/3 of taser discharges have been at people considered by police to have mental health issues. Is that a lot? What proportion would you expect? If they know, they should be telling us, and if they don’t know, the statistic is pretty meaningless. We aren’t even told how the proportion is changing over time. We do know that these uses were explicitly contemplated when NZ Police did their 2006 trial of the taser “The taser can be used by Police when dealing with: unarmed (or lightly armed) but highly aggressive people, individuals displaying irrational or bizarre behaviour, and people under the influence of mind altering substances, solvents or alcohol.”
Later on we get more useful (though not new) information from analysis of the pilot period of Taser use, where the weapons were more likely to be discharged when police attended a mental health emergency (27% chance) than when they made a criminal arrest (10% chance). This is at least answering a meaningful and relevant question, and shows a large difference, though it’s still not clear how big a difference you would expect. Mental health emergencies get police involvement because they are emergencies; many criminal arrests are much more boring and routine.
The story quotes Judi Clements of the Mental Health Foundation as saying “Once you start giving that sort of weapon to police it’s highly likely it’s going to be used”. That’s a reasonable concern, but the numbers in the story, to the extent that you can interpret them, don’t really support it. There have been 212 taser discharges over two years, from between 600 and 900 tasers, or less than one discharge per five years per taser. We aren’t told anything about what rate of use would be appropriate, but 0.2 uses per taser-year doesn’t seem all that ‘highly likely’.
Finally,
Further statistics released to the Sunday Star-Times under the Official Information Act show there are serious reliability issues around the weapons.
That’s based on lots of them needing repairs, not on failing to work, since
Despite the problems, only one weapon had failed to fire and administer a shock since they had been rolled out.
that is, 99.5% reliability in use.
It’s important for society to keep tabs on the use of tasers by law enforcement, especially because of the potential for misuse, but reporting of free-floating numbers doesn’t qualify.
Back in May, there was a really bad Herald story on pomegranates. At the time, I said,
Well, what we have is a story based on a press release about a small, unpublished, uncontrolled, open-label study. The most positive one could possibly be about this is “It will be worth waiting for the real publication” or, perhaps, “I hope it’s not true, because messing with steroid hormones like that is scary”.
Since bloggers always complain about the lack of follow-up in mainstream media, I should report back on what has happened since. There still isn’t a publication, but there is an abstract of a conference presentation.
It’s still a small non-randomized open-label study, and one that I would call uncontrolled (in the sense that there aren’t any control participants). The researchers call it ‘controlled’, presumably because there are control measurements before the pomegranate juice was started. There was a decrease in blood pressure and an increase in salivary testosterone. The blood pressure decrease (4/2.5 mmHg) isn’t very impressive, especially for an open-label study. I don’t know how impressive the testosterone difference is.
The abstract, amazingly, doesn’t actually give the dose of pomegranate juice that was used. The abstract for a previous study of the same size and duration by the same researchers used 500ml/day. According to a newspaper story this was PomeGreat brand juice, meaning that 500ml is 5 times the serving size on the package. I found a price of GBP3.39 (about NZ$ 6.60) for this daily dose (that’s the pure juice as used in the research; there are cheaper blends).
The abstract specifically says there were no conflicts of interest and no direct external funding. In previous studies the pomegranate juice has been supplied by a manufacturer, which I would have considered worth reporting as a conflict and as a source of funding. However, the research idea did come from the researchers, not the company.
So, what other research is there that might be relevant? A PubMed search for “pomegranate testosterone” gives just four papers. Only one is in live people, a study looking at pomegranate extract in prostate cancer. This didn’t find any differences in testosterone between the two doses they examined. Interestingly, this study was motivated by the idea that pomegranate would help by reducing the production of male sex hormones.
The problem with the pomegranate research is that it’s extremely widely publicised, without having been published in peer-reviewed journals. This gives the impression of more scientific scrutiny of the results than has actually occured. And it’s not that this publicity just happened. Since the results weren’t published, no-one would know about them without the help of some professional publicity machine. This phenomenon is clearly to the benefit of people selling pomegranates, but not to science or nutrition. An Ireland Advertising Standard Authority decision does illustrate one way that individuals can fight back.
The conclusion is still the same as last time:
The findings about pomegranate juice could be true, but it’s clear that the target isn’t people who actually care whether they are true.
According to the New York Times, researchers at the University of Connecticut are planning to sequence the genome of the Newtown school murderer. They aren’t specifically saying why, though the obvious interpretation is that they are looking for genetic causes of violence (there could be more cynical interpretations, but let’s not go there). This seems a bad idea.
Firstly, they won’t find anything. If you have a difference between groups of people that is completely explained by a single genetic variant, you can find the variant with genotypes on only a few dozen people in each group (eg blond hair in Melanesians, intolerance of the HIV drug abacavir). That’s still a lot more than the number of mass murderers they will have conveniently available any time soon. If the phenomenon you’re trying to explain is not controlled by a single genetic variant, the necessary sample sizes shoot up by orders of magnitude. The problem is that an individual has perhaps 2-3 million differences from the reference genome, tens of thousands of which will never have been seen before. These variants are spread through 20 000 genes, regulatory regions, poorly-understood bits of non-coding RNA, and genuine junk DNA. There would be no way to tell which of these differences is the ‘real cause’ even if there were a ‘real cause’ to find.
Secondly, what would they do with it if they found it? We already know of a common single-gene genetic variant that, in US residents, increases the risk of becoming a mass gun murderer by a factor of about 60. People with this variant are actually more likely to be employed as armed guards, and are specifically targeted by gun industry advertising. A genetic effect would have to be much larger than this to be actually useful, and that’s before you start to consider the ethical and legal implications of screening for propensity to possibly commit a crime in the future.
And finally, if you want to understand biological contributions to violence for public health reasons, it probably makes more sense to focus on the 99+% of murders that aren’t mass shootings.
(a similar list from Jeff Leek at Simply Statistics)
As you will soon get tired of hearing around here, it’s the International Year of Statistics.
The Wall Street Journal has a story on what sorts of changes in reporting we might like to see this year. These will be familiar to StatsChat readers: routine reporting of uncertainty, the need for denominators and other context, an understanding of regression to the mean, and a reduced in coincidences that are only superficially unlikely.
Recent comments on Thomas Lumley’s posts