Posts written by Thomas Lumley (2645)

avatar

Thomas Lumley (@tslumley) is Professor of Biostatistics at the University of Auckland. His research interests include semiparametric models, survey sampling, statistical computing, foundations of statistics, and whatever methodological problems his medical collaborators come up with. He also blogs at Biased and Inefficient

February 2, 2021

Vaccines new and very new

First, two new vaccines.  Johnson & Johnson and Novavax put out press releases about their vaccines last week. These are two vaccines that NZ has agreements to buy.  The Novavax vaccine is (a slightly modified version of) the viral spike protein. The mRNA vaccines (Moderna, Pfizer) get your body to make this protein, and the DNA vaccines (AstraZeneca, J&J) get your body to make mRNA to make the protein; a protein vaccine cuts out the middleman.   Novavax are reporting good results, estimating 95% efficacy against the original variants of SARS-2-CoV [?Covid Classic], about 85% against the B 1.1.7 (“UK” variant) and about 60% against the B 1.351 (“South Africa” variant). That’s as good as the mRNA vaccines against the original strains. It might well be as good against the new variants — we don’t have direct randomised trial estimates of effectiveness for the new variants and the mRNA vaccines, but we have antibody tests that suggest substantial but lower protection. Johnson & Johnson didn’t provide much data, and they aren’t claiming as high effectiveness, but they are claiming to prevent serious disease and death, and it’s a single-shot vaccine. We will presumably see more information from both companies when they are evaluated by the FDA and its European counterpart, as we did for earlier vaccines.

Next, the AstraZeneca vaccine in people over 65.  The situation has clarified a bit, though it’s still not clear what number Handelsblatt were quoting.  There is very little Covid data (so far) on people over 65, because there were very few in the trial.  This will improve somewhat when data are released from trials in India and the US.  There is good reason to expect that the vaccine would work in people over 65, but very little direct experience.  In a usual drug-approval situation there is a very strong status-quo bias: the status quo is often not that terrible; the drug doesn’t realistically promise a big improvement; you don’t want to give drug companies incentives to cut corners in trials. Usually it’s better to postpone a decision for a year or so to get better information. With Covid, the status quo is a massive human and economic disaster, and the balance of risks is very different. Leaving people unvaccinated is dangerous, epidemiologically and to the global economy as well as to them personally, so it’s not clear whether the ‘safe’ approach for regulators is to approve the vaccine for all ages or carve out an over-65 exception. It probably depends on the country.

Finally, arithmetic. Israel has been doing well at delivering vaccines, and we’re starting to see rates of infection after vaccination. These aren’t straightforwardly comparable with vaccine efficacy numbers.  A story in the Jerusalem Post has the headline Just 0.04% of Israelis caught COVID-19 after two shots of Pfizer vaccine  and goes on to say (emphasis added)

According to the studies conducted by Pfizer, the vaccine had an efficacy of about 95%, which is considered very high. The Israeli data appear to confirm the inoculation’s effectiveness, showing an even more promising result.Later in the day, Maccabi Healthcare Services – one of the country’s four health maintenance organizations – released the first results of the vaccination campaign of its members, with the organization also comparing the data to a control group that did not get inoculated.
Some 248,000 Maccabi members were already a week after the second shot as of Thursday. Of those, just 66 got infected with the virus, the majority of them over the age of 55 and about half of them with preexisting conditions. All those infected experienced only a mild form of the disease, and none were hospitalized.Over the same period of time, some 8,250 new cases of COVID-19 emerged in the control group of some 900,000 people having a diverse health profile. Those who were not inoculated were therefore 11 times more likely to get the disease than those who were immunized, showing 92% effectiveness.

95% effectiveness means you’d expect 5% of vaccinated people to test positive as infected if 100% of unvaccinated people did. Or 0.05% test positive as infected if 1% of unvaccinated people did. But 1% is a very high rate — the US, at its very worst, wasn’t getting close to 1% of the population as new cases in a week.

January 27, 2021

The 8% solution

There was a mysterious piece of vaccine news yesterday when German paper Handelsblatt claimed that the Oxford/AstraZeneca vaccine wasn’t going to be approved in Europe for people over 65 because it had only 8% efficacy in that group.  From the start, he claim of 8% efficacy was clearly either misquoted or misleadingly calculated, but it caused quite a bit of angst — and it is quite possible that the vaccine won’t be approved for older people

The problem is that the vaccine basically wasn’t tested in older people.  In contrast to the Moderna and Pfizer trials, the Oxford/AstraZeneca trials mostly recruited people under 55. The set of four trials reported in December had 428 people over 70, and fewer than 600 between 55 and 70.  Exactly none of these people had the low-dose first injection where the vaccine looked more effective. There’s more data from additional trials, eg in India, but still not very many older people recruited. In fact, about 8%* of all the trial participants were over 65.

Testing in older people is valuable because they’re the single most important group to vaccinate, and because the immune system changes with age.  It’s always possible that a vaccine will be less effective in older people, because they won’t generate as good an antibody response. In normal circumstances, a vaccine with trial data like this would probably be approved with some upper age limit — partly because of real uncertainty and partly because you want to discourage manufacturers from doing trials that don’t include the most important target populations.

Right now, though, we’re seriously short of vaccines. The trials confirm the Oxford/AstraZeneca vaccine does produce good concentrations of antibodies in older people, so there’s reason to expect it will prevent disease. As an additional encouragement, the two mRNA vaccines didn’t show any signs of being importantly less effective with age.  Soon there should be data from a Johnson & Johnson vaccine using the same basic technology as the Oxford vaccine, and it will be even more reassuring if that is effective in older people.  All in all, it wouldn’t be unreasonable to use the Oxford vaccine at least in the short term, but it’s not really surprising that there’s a controversy.

It is more surprising that Handelsblatt would get the facts so badly wrong.

Update:  An actual table with actual data has escaped on to the internet, saying that the point estimate for efficacy in 65+ year olds is 6.3%, with a confidence interval from -1400% to 94%. That is, the vaccine could make you 14 times more likely or 19 times less likely to get Covid, or anything in between. That still doesn’t really explain where the 8% number came from, but it does show the basic problem that there just isn’t direct information on efficacy in older people.  You have to either rely on the antibody levels, or not. 


* No, that apparently isn’t just a coincidence

January 21, 2021

Drunk graphics

DOT loves data has produced an analysis of alcohol consumption in NZ last year, and Justin Lester tweeted a graphic.

It’s interesting to see the impact of the lockdowns, though it’s very limiting that that the graphic refers only to liquor stores (and maybe supermarkets?) and is in terms of cash spent rather than alcohol purchased, and is only for the start of the first lockdown. The ‘increase’ includes stocking up for consumption during lockdown, as well as any real increase in consumption.  Obviously, even if total alcohol consumption had remained the same, expenditures at liquor stores would have increased with pubs and restaurants closed. And even if total consumption had decreased it’s possible that expenditures at liquor stores could have increased.

Judging from last year, we should get StatsNZ’s alcohol sales data for 2020 around the end of February, which will allow a more useful comparison.

One positive point about the graphic, though: the areas of the bottle things on the graphic are actually proportional to the numbers they represent. For example, Tauranga City’s number  went up 115%, and the bottle (on my screen) is 715×274 pixels compared to 490×186 pixels for 2019, a factor of 2.15. You often don’t see that.


January 15, 2021

Predictions and constraints

Producing plausible but newsworthy predictions can be hard. It’s especially hard in areas where there are constraints that the predictions should really satisfy.

In the NZ$ Herald,

Professor Tim Congdon from the Institute for International Monetary Research said it is extremely unlikely that the excess money will be sucked out of the system again. He warned US inflation could explode to double-digit levels before the end of next year.

“The likelihood of US inflation exceeding 3 per cent is very, very high. In my view, it is more likely to be 5pc to 10pc when it peaks, probably before mid-2022,” he said. Such an outcome would turn the global financial system upside and have dramatic ramifications for asset prices of all kinds.

One constraint here is the that the US Treasury sells both ordinary bonds and inflation-protected bonds. The ordinary bonds pay ordinary interest; the inflation-protected ‘TIPS’ pay out interest plus inflation-adjustment.  So, if you expect inflation to be 2%, you will be willing to accept 2% lower interest on the inflation-protected bonds.   The gap between TIPS and ordinary bonds tells us about the market’s expectations of inflation

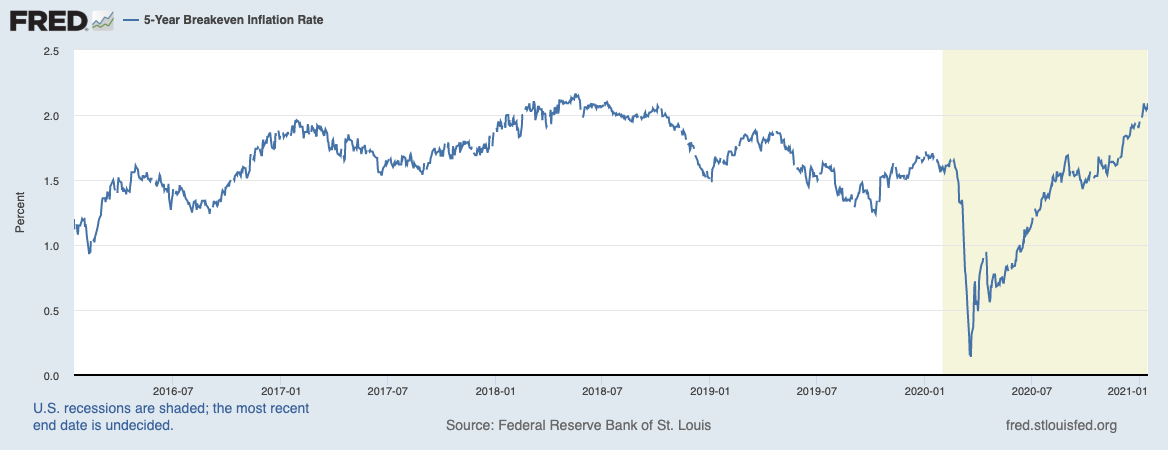
Here’s a graph from FRED, the wonderful economic stats website of the Federal Reserve Bank of St Louis, showing the five-year-average inflation rate at which you’d break even by buying TIPS.

The breakeven inflation rate has been rising, but it’s still only about 2%.  If inflation is going to average 2% over five years, it’s not going to hit 5% next year and 10% in 2022.

Now, the US financial markets aren’t infallible. You could tell a coherent story about how the US financial markets are wrong, and how there is some good reason to expect inflation that they don’t know about or don’t believe. Perhaps the M2 money supply indicator is much more important than anyone except this guy realises. I’m not an economist; I wouldn’t know.  But that’s not the story that’s being told.

January 13, 2021

The new variant, R, and why it’s more complicated than that

There’s increasing consensus that the new B 1.1.7 variants* of the Covid virus really are importantly more transmissible than the previous versions, which then raises the question of whether NZ-style lockdowns will still work.  You’ll see people trying to do simple arithmetic on the basic reproduction number, R, to work this out, but it’s more complicated than that.

In a very simple epidemic model, the number of people infected by a case is the number of people they come into contact with, multiplied by the probability that they infect each one.  You would think of interventions such as lockdown as affecting the first factor and differences in the virus as affecting the second. In this model, if a new variant has R about 1.3 times higher than the existing virus, for the same contact rate, it is increasing the infection probability by 30%.  If lockdown decreases R for the old virus from, say, 2.5 to 0.8, then it would decrease it from 2.5×1.3 to 0.8×1.3 for the new virus. That’s not a completely useless way to think, but it’s nowhere near good enough for government work.

The issue is that interventions don’t affect all transmission equally.  Imagine we had the impossible perfect lockdown, so you only came into contact with people in your bubble — any essential shopping was done by perfect zero-contact delivery or something. Obviously, the virus would not spread between bubbles; that’s exactly what we’re assuming. However, the effective reproduction number would still be greater than 1 initially, because the virus would spread within bubbles.  A combination of testing and isolation and just running out of susceptible people in affected bubbles would get the effective reproduction number down near zero eventually, but there would never have been any between-bubble spread.

In the real world, or even in New Zealand, we won’t have the impossible perfect lockdown. But back in April alert level 4 reduced between-bubble transmission a lot, and it will be combined with now knowing about masks and airborne transmission plus now having much more testing capacity than in April plus now having faster tracing than in April.  Is that enough? Well, you need a more sophisticated model to tell you, one that’s between our two simple extremes of no population structure and perfect lockdown.  We have those models, and what I’m hearing is that level 4 lockdown would work, but it’s not clear that level 3 would work.

There are other related questions where you need a model rather than simple intuition. For example, is the new variant more likely than the old ones to appear with no obvious contact to the border (as in August), making a lockdown more likely? Apparently, the answer is “yes, much more likely”.

It’s amazing how far you can get with unstructured differential-equation models for epidemics, and they are still valuable, but for some questions you need to model something closer to the real population, and it’s harder and takes longer and the results don’t necessarily have a simple intuitive explanation.


* if you don’t say “China virus”, you probably shouldn’t be saying “UK strain”

January 6, 2021

Pharmac maths

Newshub has a story about a new treatment for Crohn’s disease and some other autoimmune conditions, ustekinumab (brand name Stelara).  This is an artificial antibody that blocks a couple of immune-system signalling chemicals.

The treatment is not funded by Pharmac; that’s the point of the story.  We aren’t told how much it costs, but Matt Nippert looked it up and the US list price is US$12,332 per month.  At that price, Pharmac’s entire annual budget of NZ$1.045 billion would pay for just over 5000 people to receive ustekinumab, or about a quarter of people with Crohn’s or ulcerative colitis in NZ.  Funding it for 630 people would make it Pharmac’s highest single expenditure [to the extent you can tell, because there are secret discounts not included in the published figures]. I think this sort of information is critical to interpreting the call for Pharmac to fund ustekinumab, and it should routinely be part of reporting.

Pharmac obviously isn’t going to fund this at list price, and they could probably get a discount.  Canada seems to pay only about NZ$30,000 per year for the drug. At that price you could fund it over 4000 patients before it got to be Pharmac’s single highest expenditure. That’s still quite a lot of money that would need to be subtracted from expenditures on other drugs. 

New Zealand’s medical system saves a lot of money through Pharmac. Some of this is by negotiating lower prices. Some is by not funding drugs that don’t really work. Another unavoidable component of this saving, though, is not buying effective drugs that are too expensive, and waiting until the price drops.  I’m not going to claim that Pharmac always gets the decisions right, but it actually does pretty well, and every thousand dollars it spends on a more expensive prescription is a thousand dollars it can’t spend on multiple less-expensive prescriptions. We could increase Pharmac’s budget, but if I were going to drop another couple of billion dollars a year on the health system, I think I’d worry about surgery and cancer waiting times first.

Figures that everyone should know (or, at least, everyone with reckons on pharmaceutical subsidies): Pharmac spends about a billion dollars a year.  That’s an average of roughly $200 per person per year, or $16000 per person per lifetime.


December 20, 2020

Good enough that you don’t need statistics?

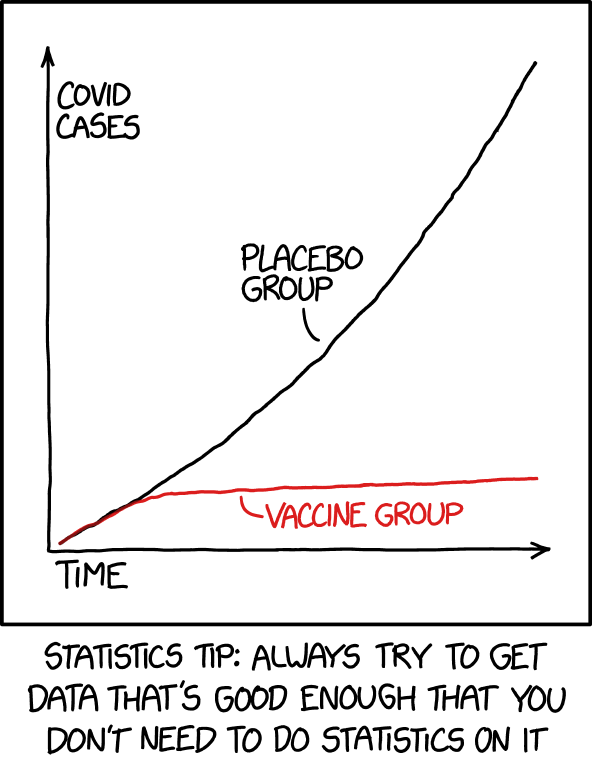
From the usually-reliable XKCD

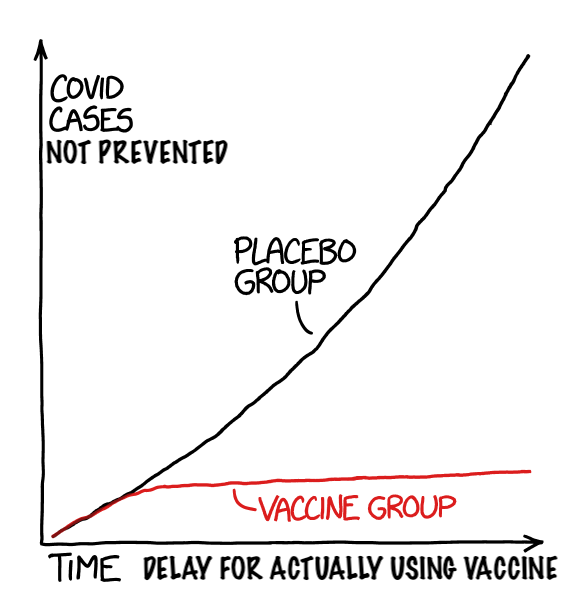
The graphs of cumulative Covid incidence for the Pfizer and Moderna vaccine trials are very impressive: the vaccines are effective.  We need to relabel the axes to see what’s wrong with the cartoon

If the trials had just been about vaccine effectiveness, they would have been much shorter.  Delaying the actual use of the vaccine, when the US alone is getting 1.5 million cases a week, just in order to get a pretty graph and avoid using statistics would be … ethically questionable. No matter how you felt about your high school stats class. If we only cared about effectiveness, the graph would look more like

The reason the trials ran so long was to assess safety.  Everyone in the trials was followed up for six weeks after their second vaccine dose, because that’s long enough to see any adverse reactions that have been seen for past vaccines.  The very high rate of new cases in the US and other countries involved in the trials, together with the high effectiveness, meant that effectiveness could be demonstrated much more quickly than safety — but safety is important.

Safety is especially important for us in NZ, where there is less urgency than in the US or UK.  Medsafe will be looking at whether to approve the vaccines and under what conditions, and they’ll be doing more than “We reject the null hypothesis based on the ‘hot damn, check out this chart’ test.”

December 16, 2020

Covid vaccine #2

We now have fairly detailed data on the second Covid vaccine, the one from Moderna.

Again, I’ll add more as I see them.

Causes and implications

From the Herald

A coroner has warned of the dangers of driving while impaired by drugs after reviewing nine fatal vehicle crashes and finding cannabis use was implicated in six of them.

but further down in the story

He was found to be almost five times the legal drink-drive limit while also testing positive for cannabis and its constituent element tetrahydrocannabinol (THC).

At a blood alcohol concentration of 0.25%, your risk of a crash has increased by more than a factor of 100.  That is, more than 99 out of 100 crashes in people with blood alcohol of 0.25% will be caused by the alcohol. You don’t need cannabis use to explain a crash like this, and it’s not clear that there was any relevant cannabis use.  The report says the driver was at a BBQ where people were drinking. There is no suggestion in the story that anyone was smoking weed (though it isn’t specifically ruled out).

The description of testing positive for “cannabis and its constituent element tetrahydrocannabinol” is also a bit weird.  I think they just tested for THC; that’s what I’ve seen in previous reports from ESR, who do the testing.  And they can pick up very small amounts of THC; a 2012 publication on tests after fatal crashes reported a range from approximately 0.1 ng/mL to 44 ng/mL (mean 5.6 ng/mL) concentration in blood samples.  Some of these people will have been impaired by THC, but by no means all of them.  ESR are careful about how they report this sort of thing, and don’t write things like “cannabis use was implicated” when they mean “THC was detectable”, but the coroner seems to be less careful.

The coroner didn’t say anything about alcohol use in the other eight fatal vehicle crashes.  You’d hope, if he’s making those sorts of statements about drugs that some of the crashes didn’t involve large amounts of alcohol and had evidence of recent consumption of cannabis or some other reason to think it was really implicated, but you’d also hope he’d make that clear if it was true.


December 15, 2020

New, improved Covid?

From Radio NZ

A new variant of coronavirus has been found which is growing faster in some parts of England, MPs have been told.

From the Herald (from the Telegraph)

A new variant of coronavirus has been identified in England and is spreading rapidly.

There is a sense in which this is true. The virus is spreading rapidly in southern England. And, because new mutations arise all the time and get passed on as the virus is spread, there is a new mutation that is more common in these new cases. However, there’s currently no evidence that there’s anything about this mutation that affects the spread of the virus at all.

Over the year,  thousands of genetic variants have been seen in the coronavirus (a paper a few weeks ago looks at 12000).  Some of these have become common, and so  might possibly  be better at spreading  Some mutations have arisen more than once and so might possibly be better at spreading. Mostly, though, variants have become common because they’ve found themselves in favorable circumstances — in people who don’t wear masks, or people who live in crowded situations, or people who go to church and sing, or who attend motorcycle rallies, or whatever. These variants are common because they won the lottery, not because they worked smarter and harder or had a #8-wire can-do attitude.  And, to be fair, the stories do later go on to admit this, or at least raise it as a contrasting view.

So far, there is one variant, called D614G, with reasonable (though not overwhelming) evidence that it makes a bit of difference to coronavirus transmission.  For example, a recent paper on it says

Although evidence is still accumulating, the increasing predominance of D614G in humans raises the possibility that viruses with this mutation have a fitness advantage, perhaps allowing more efficient person-to-person transmission. Our virological data are consistent with, but do not themselves demonstrate, this hypothesis. Interestingly, this mutation does not appear to significantly impact disease severity

In contrast, the Herald, (from news.com.au) back in July wrote about the D614G variant

The worst fears of epidemiologists have been realised: Covid-19 has mutated, and the strain now dominating the world is up to six times more infectious.

Fortunately, it wasn’t anything like six times more infectious.  This new one probably won’t amount to much either, though the people who look at Covid genomics will keep track of it like they do with all the other variants.


Update: useful Twitter thread for people who want nerdy details.