Posts written by Thomas Lumley (2645)

avatar

Thomas Lumley (@tslumley) is Professor of Biostatistics at the University of Auckland. His research interests include semiparametric models, survey sampling, statistical computing, foundations of statistics, and whatever methodological problems his medical collaborators come up with. He also blogs at Biased and Inefficient

December 9, 2020

Election hypothesis testing

As you may have heard, there are people who are unhappy that Joe Biden is president-elect and think the courts should do something. In today’s most statistically interesting lawsuit, Texas is suing Georgia, Michigan, Pennsylvania, and Wisconsin, asking the Supreme Court to overturn their election results.  Legal Twitter does not appear convinced (on legal grounds).

There’s also a Declaration from an Expert arguing that the results are statistically impossible without fraud. This is statistics, so we can look at some of it here. It’s straightforward hypothesis testing, of the type we teach in high school.

Starting on paragraph 10, he’s looking at votes in Georgia and doing hypothesis tests on binary data. The tests being done are

  1. Comparing the total number of votes for Joe Biden with the total number of votes for Hillary Clinton in 2016
  2. Comparing the proportion of votes for Joe Biden (as a fraction of the 2020 vote) with the proportion of votes for Hillary Clinton (as a fraction of the 2016 vote)
  3. Comparing the proportion of votes for Biden (vs Trump) in ballots counted before and after 3:10am on election night

In all three cases, he finds very strong evidence that the two groups being compared are more different than if they were sampled independently from the same probability distribution.  The idea is that while massive undetected fraud is unlikely, if the observed data are even more unlikely we need to consider fraud as an explanation.  Clearly, this only makes sense if the mathematical null hypothesis being tested really would be unlikely in the absence of fraud.

Straw-man null hypotheses can be a problem in science: people will set up a null hypothesis that there’s no difference (or no important difference) between  two groups, even when no reasonable person would have entertained the possibility that the groups are the same, and the real question is how much they differ.   This election analysis has the same problem.

In test 1, we know that 2016 was four years ago, so the population has grown. We also know turnout was higher all over the US, including in states/counties/precincts won by Trump. For example, in Texas (where Texas is not seeking to overturn the results), 8.56 million people voted for Trump or Clinton in 2016 and 11.15 million voted for Trump or Biden in 2020.  The null hypothesis never had any reasonable chance of being true; finding that it actually is false is not surprising and provides no motivation for considering more esoteric explanations.

In test 2, the overall turnout and population change are taken into account.  A difference between Biden and Clinton’s percentage would be hard to explain unless Biden were actually more popular than Clinton with Georgia voters.  There are at least two reasons this would not be astonishing. Biden is more popular generally, and he’s specifically more popular with Black voters, who are making up an increasing fraction of the Georgia population. So, finding that Biden was more popular than Clinton with Georgia voters is not surprising, and provides no motivation for considering more esoteric explanations.

In test 3, the comparison is between votes counted earlier and votes counted later than 3:10am.  The statistical test provides strong evidence that votes counted early had different preferences from those counted later.  This would be surprising if you’d expect the two sets of votes to be identical — eg, if you mixed all the ballots together and counted them in random order. It turns out that this is not what happened.  The early votes were primarily those cast on election day; the later votes primarily those cast in advance.  The statistical test provides strong evidence that people voting in person on election day were different from those voting in advance. Again, this is not remotely surprising given the different perspectives on the pandemic offered by the two campaigns.

There are actually some technical problems with the statistical testing, but these pale in comparison to the problem of not testing hypotheses that have any real bearing on the fraud question.  It’s hardly worth mentioning the technical problems, except that this is a statistics blog.   The analysis treats the  votes in each comparison as independent observations. In fact, the comparison in test 3 will be subject to clumping: groups of people will affect each others voting preferences, and the percentages will have more variability than if they were from five million independent coin tosses. The evidence (against the straw-man null hypothesis) will be weaker than you’d compute from a model of independent coin tosses.

In tests 1 and 2 there will be this clumping, but in the other direction there’s the problem that the 2016 and 2020 votes are mostly from the same people.  If you asked people their vote today and tomorrow you’d expect the same answer from most people. If you asked in 2016 and 2020 the concordance would be weaker, but you’d expect it to still be there.  So, the statistical test would not actually be valid even for the straw-man null hypotheses, but it’s hard to say precisely how misleading it would be.

Vaccine data

The FDA has released its briefing document and Pfizer’s briefing document for their external advisory committee meeting on Friday.  Lots and lots of lovely detail.

Useful summaries and interpretations (I’ll add more as I come across them):

You can watch the FDA advisory committee meeting, from 4am to 1pm Friday morning NZ time, and I assume there will be a recording available afterwards. It will be very boring, but transparency is like that.


PS: there is also a new publication from the Oxford group about some of the Oxford/AstraZeneca trials. It’s not really going to make anyone happy.

PPS: Next week, the FDA does the Moderna vaccine, but that’s less interesting for NZ since we didn’t buy any.

December 7, 2020

Vaccine effects and effectiveness: fair comparisons

Thinking about vaccine effectiveness is tricky, but Senator Rand Paul has a medical degree so he has no excuse
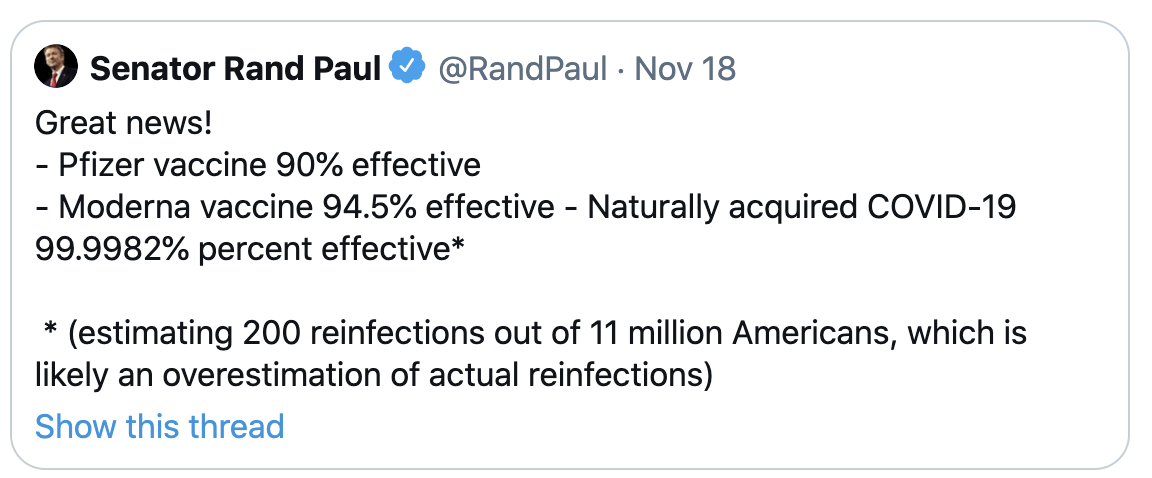
The Pfizer vaccine had seen 8 Covid cases in 22,000 people vaccinated.  If the way you computed vaccine effectiveness was to divide the number of infections by the number exposed, the way Paul has done for ‘naturally acquired Covid-19’, the effectiveness would be 21992/22000= 99.96%. Sounds pretty good!

On the other hand, if that was the way you computed effectiveness then just being in the US would be 95% effective — more than 95% of people in the US have yet to get Covid.  As being in the US increases your risk of Covid, we can be sure this isn’t the right way to do the computation.

Vaccine effectiveness requires a fair comparison between two groups: one group who gets the vaccine and one group who doesn’t.   We do this with randomised trials because it’s really hard to be confident about fair comparisons any other way.   When we say the Pfizer and Moderna vaccines are 95% effective in preventing symptomatic Covid-19, we mean that the proportion of people getting symptomatic Covid-19 in the vaccine group was 95% lower than the proportion in the placebo group.

There’s currently no real basis for saying immunity based on infection is higher or lower than immunity based on vaccine (except for the trivial point that getting Covid naturally is 0% effective as a way of not getting Covid at all). It’s a hard problem.

We obviously can’t randomise people to having had ‘naturally acquired’ Covid-19 infection. What we’d need to do to estimate the effectiveness is find large groups of comparable people who were and weren’t infected back earlier this year, make sure we gave these groups the same risks of exposure to Covid-19 and the opportunities to get tested, and count the number of new cases.   So, we’d need to find some region that had very high rates of infection back in February/March, with reliable testing, and that has very high rates again now, again with reliable testing.  You couldn’t do this study in the US, because infection rates are currently high in different parts of the country from the first wave. You couldn’t do it in Wuhan, because rates there are low. Sadly, it looks like there is one candidate region, Lombardy in northern Italy, but they have other priorities right at the moment.

Because we don’t have direct comparative evidence on natural immunity, we’ve only managed to do two sorts of analysis. First, by looking at people who have had two sets of viral genome sequencing, we can be 100% sure that some people get reinfected. Second, by looking at immune responses of people infected early in the pandemic, we know that the biochemical markers of immunity are looking pretty stable out as far as we have data, which is only six months or so.

The same sort of problem happens for vaccine adverse reactions.  First, an important distinction: adverse events are bad things that happen after you got the vaccine; adverse reactions or adverse effects are bad things that happen because you got the vaccine.  You can observe adverse events; adverse reactions are a theoretical explanation.

In randomised trials, we know the people who did and didn’t get the vaccine were otherwise comparable, so we do know that any big differences in adverse events must be caused by the vaccine — they are adverse reactions.  The Covid vaccines have a high rate of mild to moderate short-term adverse reactions (including pain at the injection site, fatigue, fever, chills).  These only last a short time, and they are better than Covid, but they are not trivial.   There are also small numbers of serious adverse events in the trials, and we’ll hear more about the extent to which these are likely to be caused by the virus. Because so many people were in the trials, we know that any adverse reactions we haven’t seen in the trials must be rare (or long term). Against all of that, we know there are serious medical, social, and economic effects of not ending the pandemic, even here in relatively-secure New Zealand.

However, when we start vaccinating people there will be lots of other adverse events, because there are always adverse events.  If you gave a placebo injection to everyone in New Zealand there would be about 25,000 new cases of cancer over the following year — because 25,000 new cases of cancer is what happens in a typical year in New Zealand.  About 5800 people would die of heart disease, because 5800 people dying of heart disease is what happens in a typical year in New Zealand. About 140 people would be diagnosed with motor neurone disease and maybe 60 with Guillain-Barré syndrome, again, because that’s what happens in a normal year. If you give a vaccine injection to everyone in New Zealand, then on top of any real effects of the vaccine, the same things will happen, and some of them will look as though they are caused by the vaccine. Many of these would make good stories, and I’d hope the media will be careful what they do with them.

The best bet for distinguishing adverse reactions from adverse events that would have happened anyway is careful statistical analysis of big medical databases here (through the Centre for Adverse Reactions Monitoring) and even bigger ones in the US (the Sentinel Initiative), but even there it will be hard to tell whether a moderately higher rate of a rare event next year is coincidence or a side effect.  It’s quite possible that there will be real, rare vaccine effects, and we can be absolutely sure there will be spurious apparent vaccine effects.

November 21, 2020

Thanksgiving risks

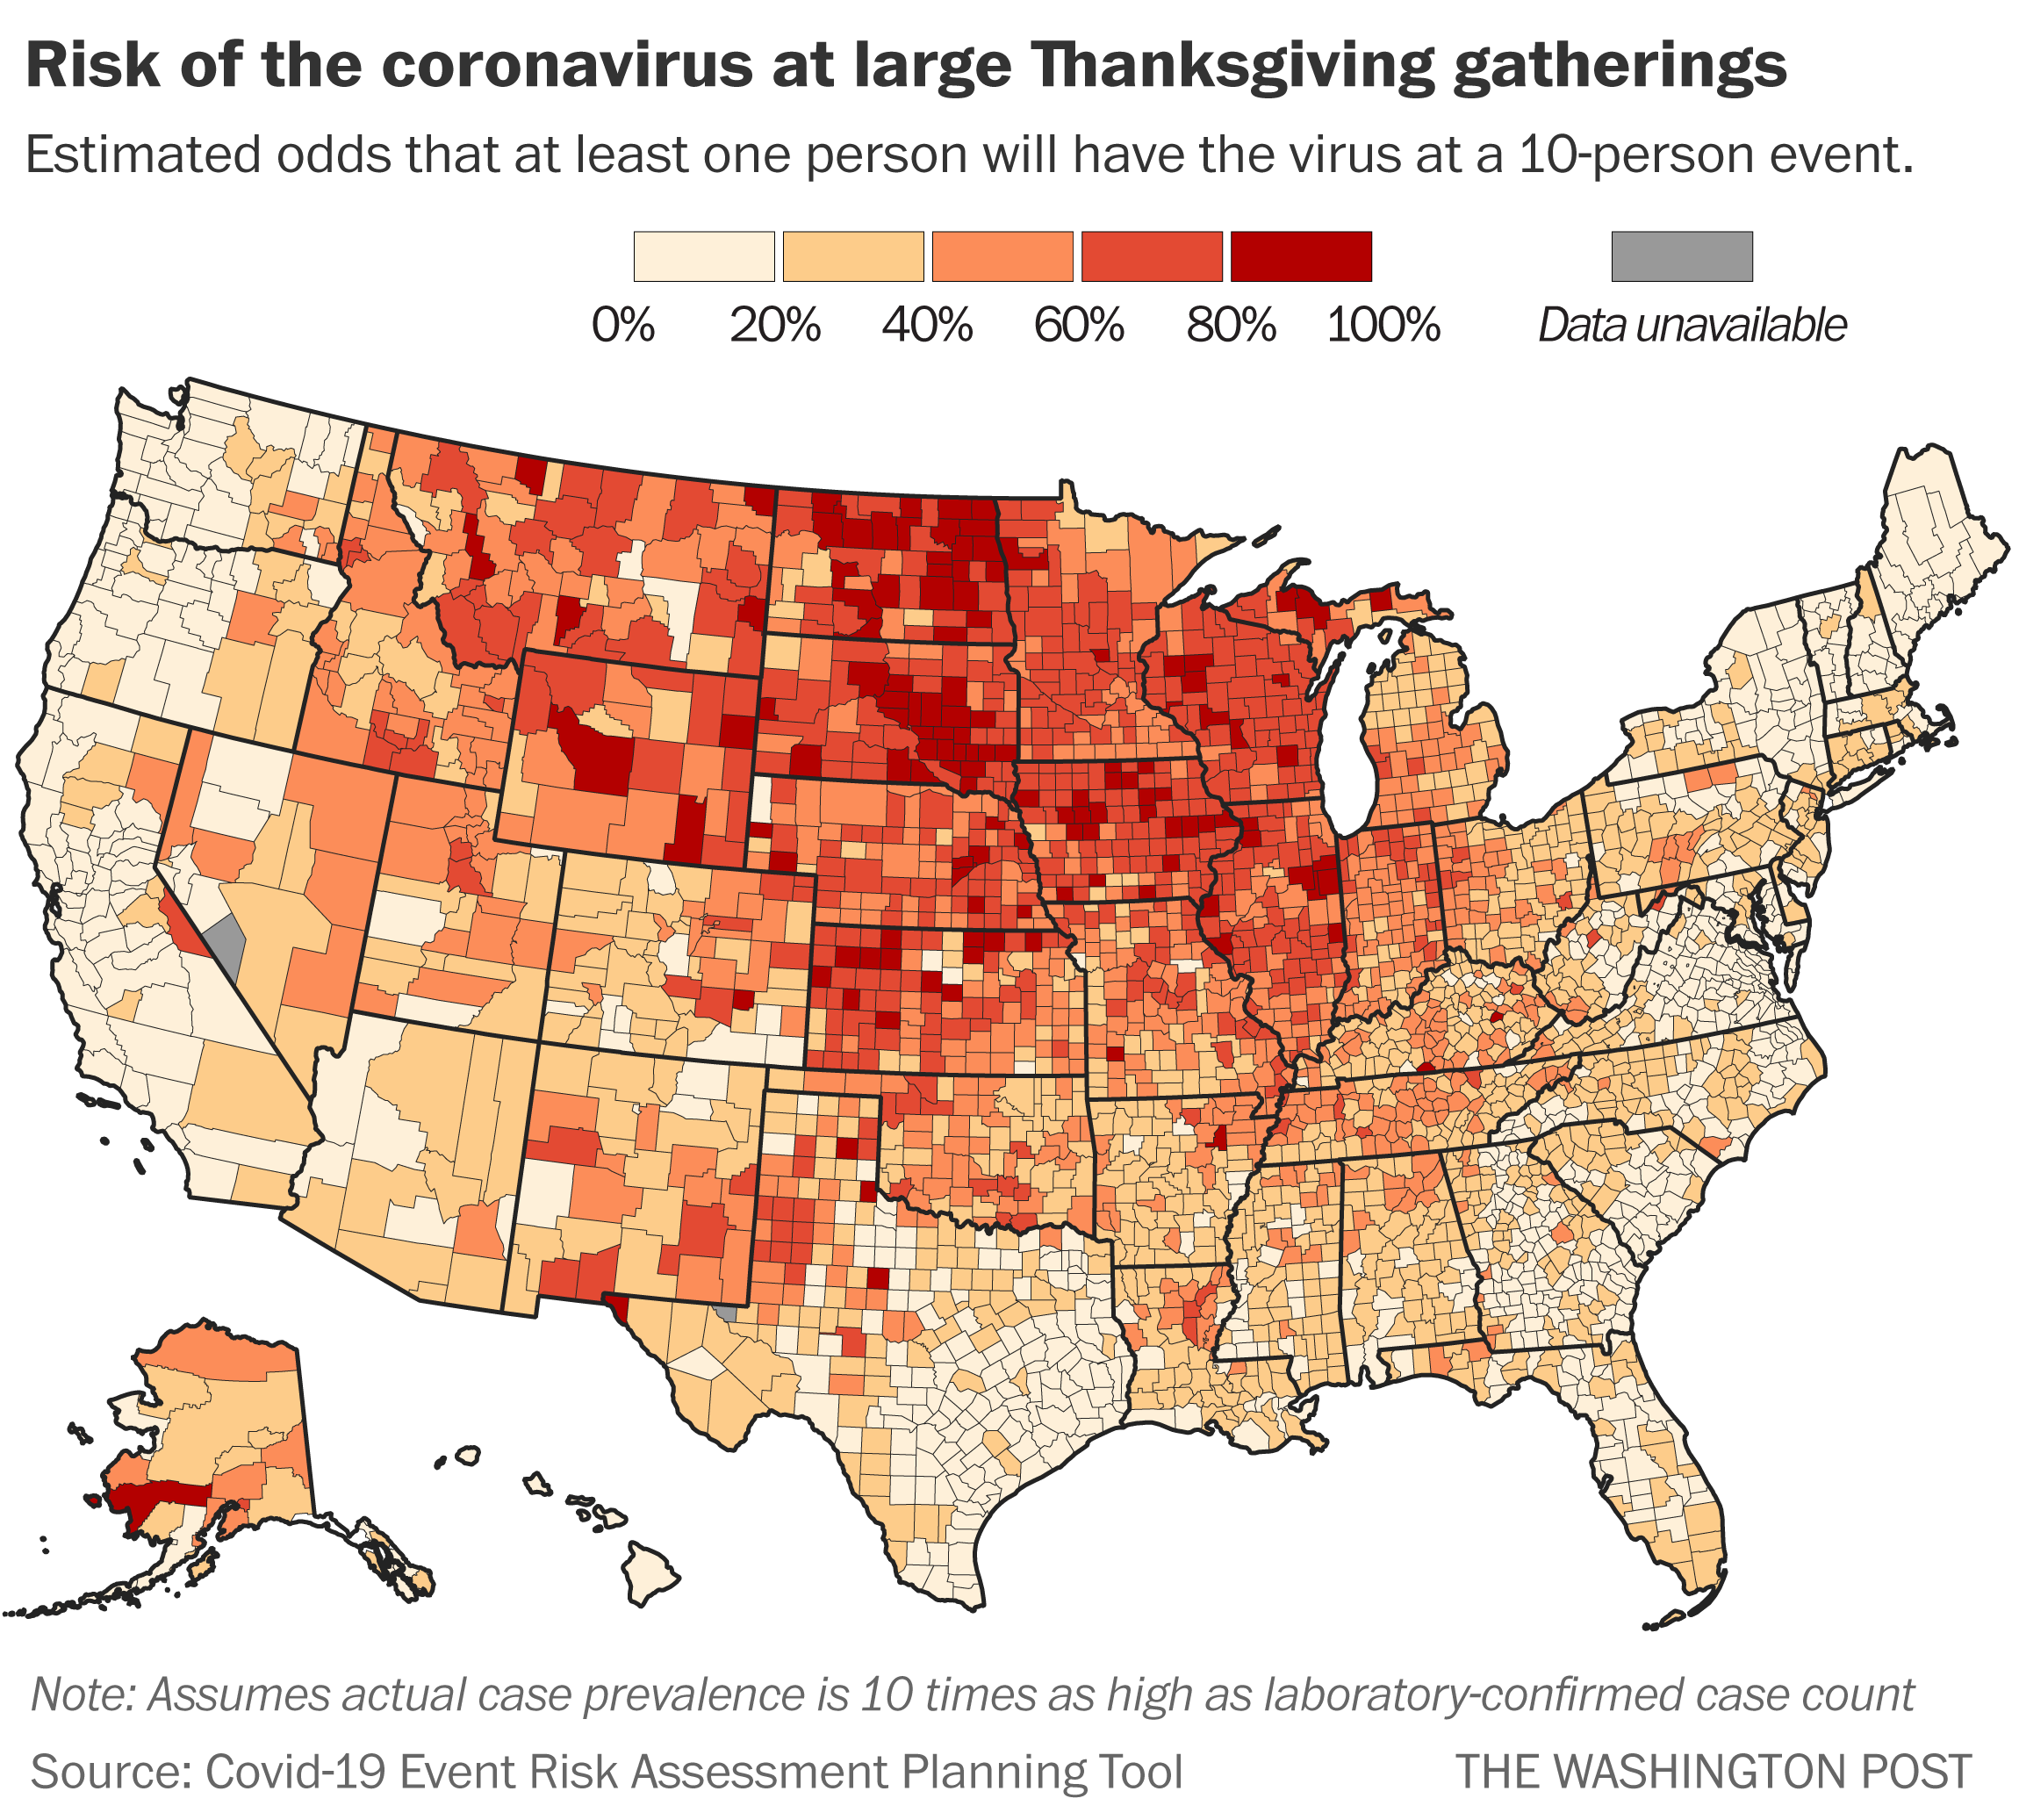
It’s quite difficult to exaggerate how bad the US coronavirus epidemic is. The Washington Post has managed.  They have a map showing the probability that a gathering of 10 local people for Thanksgiving will include at least one Covid case. They say

At the county level nationwide, the average estimated risk of running into a coronavirus-positive person at a 10-person gathering is just a hair under 40 percent. 

As the note on the map says, it assumes the actual case prevalence is 10 times the number of people with positive tests.  That’s a bit high — it comes from much earlier in the year, when testing was rarer).  It’s also a bit high if we assume that obviously unwell people (who are included in the prevalence estimate) are more likely to skip the celebration.

On top of that, though, the calculations (based on this paper) assume Covid infection status for the 10 participants is independent.  That was a reasonable approximation for the original paper, which looked at public gathering.  It’s not a great assumption for Thanksgiving, where people tend to attend in household groups.  The ‘effective’ gathering size will be less than the number of individuals, and closer to the number of households participating. So, if the prevalence is 1%, the risk based on three independent households is about 3%; the risk based on 10 independent people is about 10%. The truth will lie somewhere between.

And, as you can tell from looking at the map, there’s something wrong with saying the nationwide average risk is 40%, since 0-20% range includes nearly all the high-population parts of the US. The 40% is an average of counties, with no easy way to translate it into a risk for people.

Why am I pointing this out, when the map only strengthens the sensible public-health advice to stay the fuck away from Thanksgiving dinners? Because it is not true that 40% of the ten-person Thanksgiving gatherings in the US (and the vast majority of those in the Dakotas) should expect to come down with Covid this week, and people will notice that it wasn’t true. The truth doesn’t just matter for ethical reasons, it matters for any effective risk communication that isn’t just a one-shot attempt.

November 19, 2020

Effectiveness of masks?

There’s a new study from Denmark that, if you don’t read carefully, looks like it has found evidence that masks don’t work to stop Covid. You’ll probably be hearing about it. [Update: on Newshub now] Here’s the NYTimes take.

The study randomly allocated 5000 people to wear masks or not, and found 42 people with antibodies to the Covid virus in the mask group and 53 in the no-mask group. From the abstract, the researcher concluded

The recommendation to wear surgical masks to supplement other public health measures did not reduce the SARS-CoV-2 infection rate among wearers by more than 50% in a community with modest infection rates, some degree of social distancing, and uncommon general mask use.

The results for actual diagnosed infection were a bit better: 5 vs 10.

Let’s look at the ‘limitations’ reported in the abstract

Inconclusive results, missing data, variable adherence, patient-reported findings on home tests, no blinding, and no assessment of whether masks could decrease disease transmission from mask wearers to others. [emphasis added]

So, based on a study that was too small, they argue that a mask doesn’t reduce your personal chance of being infected by more than half, and they didn’t look at whether it reduces your risk of infecting other people.

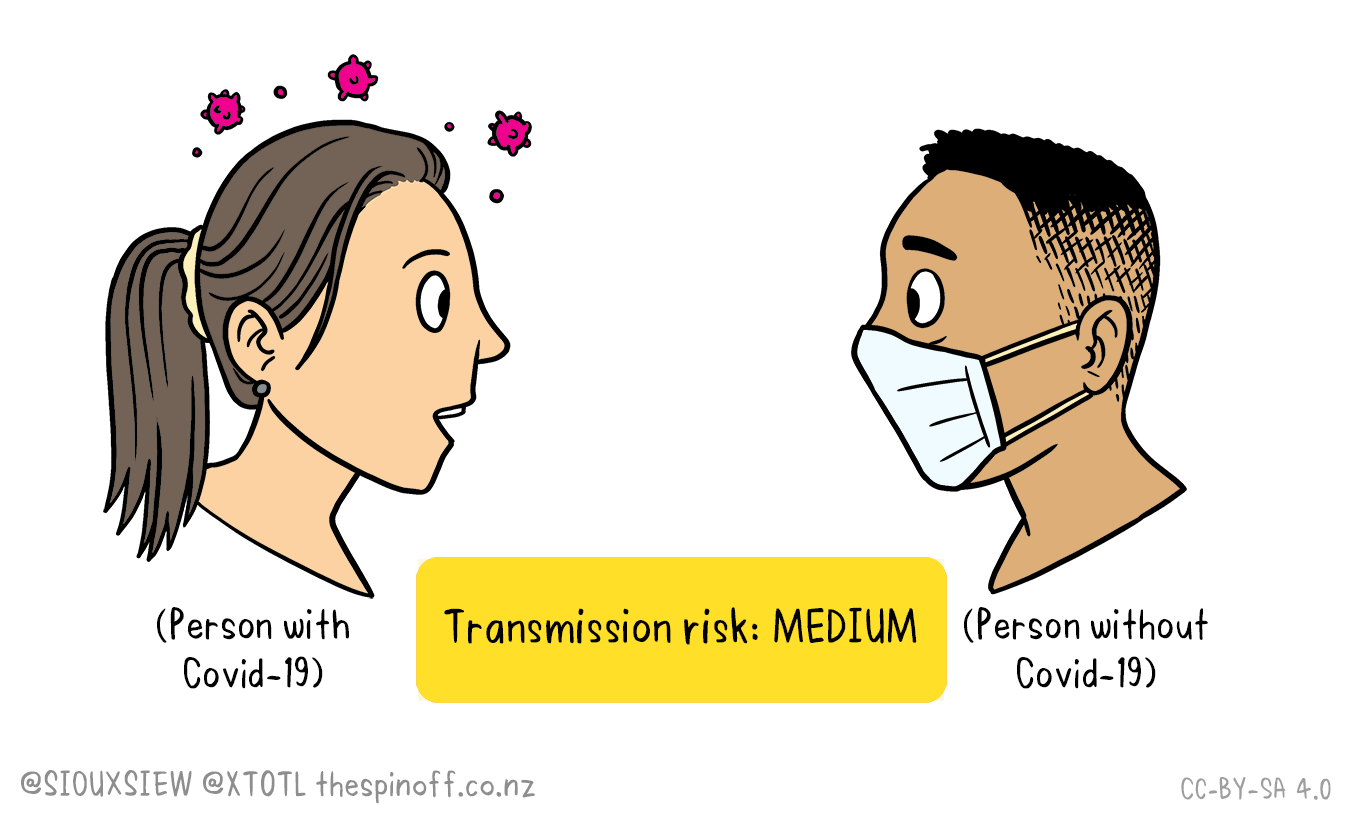
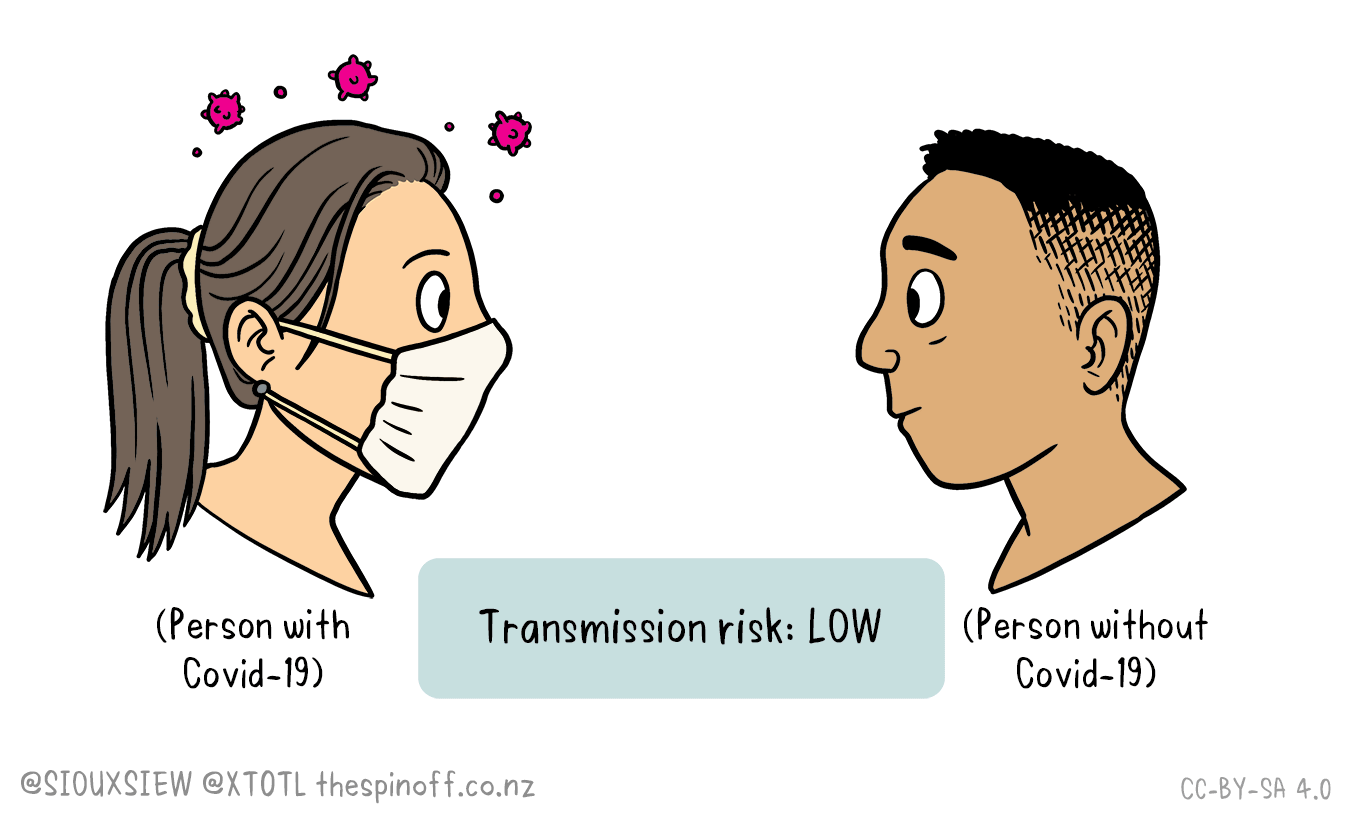
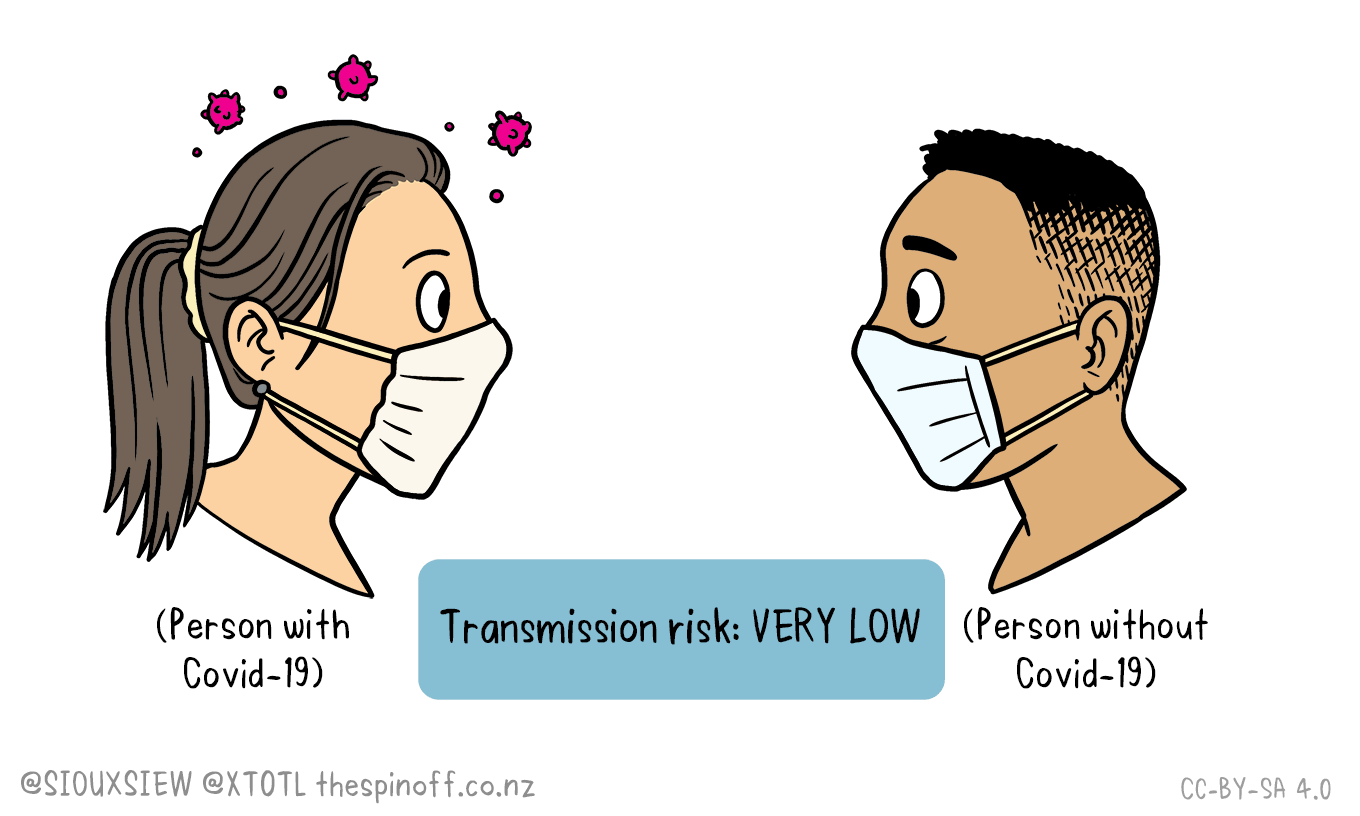
In NZ, our mask advice (and, from today, rules) is based on the benefits both ways, but more on reducing your risk to other people. Here’s the message from Toby Morris and Siouxsie Wiles

and

and

It’s hard to get rigorous evaluations of the benefits of masks. Most of the evidence we have comes from theory (it stops droplets, so it should reduce infection), from individual examples (eg two hair stylists who didn’t infect any of their clients), and from comparisons of trends between countries, states, and counties with different polices.

There are good reasons to believe masks reduce risk. It would be nice to have the sort of evidence we have for the new vaccines, but that’s not going to happen — and at least masks are safe and only slightly annoying.

November 18, 2020

Common exposures are common

Q: Did you hear that pizza boxes are going to stop the Covid vaccine working?

A: You mean people will mistakenly store the vaccine in pizza boxes instead of ultracold deep freeze?

Q: No, research shows that pizza boxes and lots of other things contain chemicals that stop vaccines working. According to the Guardian.

A: Even the Guardian says “At this stage we don’t know if it will impact a corona vaccination”

Q: And is that true?

A: No.

Q: What?

A: The story says these chemicals are ubiquitous, with the majority of people being exposed.

Q: Yes, that’s the scary part

A: So people in the Covid vaccine trials will also have been exposed.

Q: I suppose so?

A: The trials estimate the effect of the vaccines in a reasonably diverse group of people from the US population.  If polybathroomfloorine, or anything else widespread, has an adverse effect on the vaccines, that’s already baked in to the trial results.

Q: So without the chemicals, the vaccines might have been, say, 95% effective?

A: If you believe there’s a relationship, yes, that’s what you’d think.

November 17, 2020

And then there were two

We have data on a second Covid vaccine candidate, and it’s similar to the first one.  Moderna  released their first analysis results today: out of 95 cases of Covid, 90 were in the placebo group and 5 in the vaccine group . Even better, they had enough cases of serious disease to analyse, and these split 11:0.

Both of the vaccines use the same new technology, where little bits of messenger RNA, coding for the virus spike protein are introduced into your cells. Your cells make the protein just as if they’d been infected and your immune system reacts.  At least, that was the theory, and it does seem to have worked.   We haven’t heard from any of the trials using more traditional technologies, which would produce vaccines that are easier to distribute and may be easier to manufacture by the truckload.

The next important step, fairly soon, is an FDA external advisory committee meeting.  This should be more informative than peer-reviewed publication: it’s peer review, but involving a lot more information than goes into a published paper, and a wider range of reviewers — and it’s done in public.

There are still problems to be considered:

  1. The vaccines have not been tested in children or pregnant women. That’s standard, except for treatments specifically aimed at children or pregnant women, but it’s an important gap.  The pregnancy exclusion is probably less important from a public health point of view, since a very small fraction of the population is pregnant at any given time. Kids, though.
  2. We don’t know yet how long protection lasts — if it’s only a few months, that’s a problem
  3. We don’t know yet how much asymptomatic infection is prevented
  4. NZ doesn’t seem to have bought any of the Moderna vaccine yet — the Minister says we’re in negotiations

Also, these vaccines are going to have more short-term side effects than we may be used to: a lot of people will feel a bit average the day after a dose, and a decent chunk will feel pretty average. That’s going to help the vaccine misinformation pushers, especially if health authorities aren’t honest about it.

November 13, 2020

Value of a degree

Simon Collins (and Chris Knox) at the NZ$ Herald have an interesting piece about the relative incomes of university graduates and other people. It’s definitely worth reading (even though you can’t look up Statistics or Data Science or Journalism).  However, there’s a built-in assumption of causation that is not entirely justified

Getting a degree can earn you a cool $1.3 million more over your lifetime than leaving school and going straight into work – but the gains vary wildly depending on what subject you study.

One of the irritating features of Graduation at the University of Auckland is that the Chancellor’s speech always includes a similar claim

We know that, compared to those whose formal education ends in high school, graduates have lower unemployment rates, higher salaries, better career prospects, and better health outcomes.

I actually used this as the topic for an exam question on causal inference in first semester.  The preamble to the question says

In economics and sociology there are competing theories to explain the higher income of people with university degrees. Here are three possible examples:

  • A Human Capital theory says that university education improves both specific knowledge about certain topics and some general reasoning and communication skills, so that people who gain university degrees become more valuable employees than they would otherwise have been. Some degrees are more valuable than others because you learn more employment-relevant skills doing them.
  • A Signalling theory says that university education is difficult, and gaining a university degree shows employers that you are more able than other potential employees, even though the education you receive is not valuable to the employer. Some degrees are more valuable than others because they are more difficult and so people who get those degrees have higher average ability.
  • A Social Stratification theory says that university education functions to show that you come from a relatively affluent or otherwise high-status family, and so you are not the sort of person that the employer likes to discriminate against. Some degrees are more valuable than others because they discriminate more effectively against low-status people.

These theories are probably all true in part.  Under the first theory, the increase in income is due to your study, but under the other two it’s only partly due to your degree and you’d probably have a higher than average income anyway.  The difference matters most for members of underrepresented groups: under the first theory, they’d benefit as much as anyone from education. Under the second theory they’d benefit more, but under the third theory they’d benefit a lot less.

November 10, 2020

Covid vaccine

So, there’s good news about the Pfizer vaccine.  Some context:

  1. What we have now is just a press release. However, the analysis and criteria were specified in advance, and we actually have that document, so it’s less fuzzy than it might be
  2. Data are still coming in, so the estimate of vaccine efficacy will change over time to some extent.  In particular, we wouldn’t have heard anything if the estimated efficacy wasn’t at least 63%, so the current estimate is likely a bit too high.  The current estimate is so far above the threshold of 63% that this bias shouldn’t be huge
  3. The trial focuses on preventing symptomatic infection. We haven’t heard anything about the impact on serious disease or on asymptomatic disease. The impact on serious disease is, oddly, less important, since the vaccine is good enough for herd immunity. However, if the vaccine (a bit implausibly) had no effect on serious disease and just made symptomatic infections asymptomatic, it wouldn’t be that much use.  Pfizer are collecting this information; it just wasn’t in the press release.
  4. The next important step isn’t peer-reviewed publication, it’s the FDA external advisory committee meeting. These are public and involve scientists and doctors external to the FDA who get to ask Pfizer questions and have them answered.  If the advisory committee is strongly in favour of emergency authorisation, I would expect Medsafe to reach the same conclusion.
  5. Duration of effect matters.  We cannot possibly know for another year whether protection lasts for a year (which would be plenty).  Very short duration of protection would still have some use for making travel safer and for ring-fencing small outbreaks, but it wouldn’t have much impact on the pandemic
  6.  New Zealand is in line for enough vaccine for  750,000 people, and Megan Woods says it could arrive early next year.  That’s not enough to have any noticeable impact on population spread, but it is enough to reduce transmission to border staff and healthcare workers. It might even allow some increase in the safe admission to NZ of temporary workers or students — the government needs to decide how to allocate the vaccine.  Expanding on this: a vaccine could be used to reduce the probability of an outbreak, to increase travel and help the economy, or to reduce the harm of an outbreak (eg vaccinating elderly people). These are all worthwhile and the detailed choice is a policy question.
  7. Mass vaccination won’t happen for a while.  Even if other candidate vaccines are effective (increasing the number of suppliers), mass vaccination in NZ is probably at least a year away
  8. If the current estimate holds up, the vaccine is effective enough that we might get reasonable herd immunity by vaccinating only people who actually want to be vaccinated, which would make life simpler.
  9. The Covid vaccines seem to have a higher rate of mild adverse effects than most vaccines we’re used to. It’s important not to deny these, and it would be useful if there were careful monitoring of adverse event rates in the first wave of NZ vaccine recipients by, eg, the NZ Pharmacovigilance Centre
November 3, 2020

Do first home buyers cause housing shortages?

From a story by Eva Corlett at Radio NZ

Property Investors Federation’s executive officer Sharon Cullwick argued while property investors may not be helping the housing supply problem, they aren’t hindering it.

But she said first home buyers are, when it comes to purchasing rentals off the market.

“If a first home buyer purchases a property that was a rental property, then you’ll need another house to house the extra people living in that rental house.”

“So every time a first home buyer buys a house even though it’s great they are getting into the market – it actually makes the housing crisis worse,” she said.

This is obviously a convenient thing for the Property Investors Federation to believe, so it’s worth looking at the evidence.  It’s true that property investors, as investors, aren’t reducing the housing supply (just the housing for sale and perhaps its affordability).  But are first home buyers?

Clearly[citation needed]  rental houses don’t just disappear, like those mysterious shops selling magical artefacts, when the renters move out and buy a house.  For every rental house that we lose, an owner-occupied house is created; to first order, nothing changes.

The claim being made is more subtle. We know that owner-occupied homes have fewer people living in them, on average, than rented homes.   If that difference is directly caused by being owner-occupied, then having more home owners would cause a reduction in average household size. While it wouldn’t cause a decrease in housing supply, it would increase the gap between demand and supply.

We can assume for the sake of argument that this isn’t primarily due to different sorts of homes being rented vs owner-occupied and say that, on average, a given home will have more people (or, at least, more adults) living in it if it is being rented than if it is being occupied by the owner.  Even stipulating all that doesn’t actually settle the question.

What we’re talking about here is the process of household formation. In the traditional Hallmark/Disney version, people start off living with their parents, they proceed through a stage of living with friends (or at least with flatmates), and then end up living in couples who eventually have 2.3 kids.   The number of adults per household tends to decrease as you go from the flatting stage to the couple stage, and also there i traditionally a progression from renting to owning your home. Because these transitions both happen over broadly the same age range, there’s an automatic tendency for them to be correlated. At 20, people are more likely  to be both renting and living in large households than at 40.

Here, though, we have a stronger claim, that buying a house is, in Auckland, the immediate cause of smaller households, or the even stronger claim that this is necessarily true.  The strongest version is clearly wrong: it is quite possible for people to form small, stable adult households while living in rental accomodation or, conversely, to buy a house but still have flatmates to help pay the bills. Data on household sizes are not what you’d need to settle the intermediate claim. It could be true, but it could also be false.

But suppose, again for the sake of argument, that the Property Investors Federation was correct: that there is a genuine causal connection and that buying (rather than renting) real estate is an unavoidable step in household formation for many people. To the extent that buying a house is inextricably linked to household formation, blaming first-home buyers is as inappropriate as blaming babies or immigrants or people moving from the rest of NZ or people with home offices. The housing crisis is the problem: it’s impeding adult household formation, and preventing families with kids getting enough space, making it harder to work from home, and making it harder for people to move to Auckland from the rest of NZ or the rest of the world.

Auckland has a housing crisis because there aren’t enough homes. This has not largely been due to changes in ownership distribution: we used to have more young homeowners, not fewer. Rules and procedures designed to impede building new homes have been a bigger contributor.