Posts written by Thomas Lumley (2645)

avatar

Thomas Lumley (@tslumley) is Professor of Biostatistics at the University of Auckland. His research interests include semiparametric models, survey sampling, statistical computing, foundations of statistics, and whatever methodological problems his medical collaborators come up with. He also blogs at Biased and Inefficient

October 22, 2017

Bogus-poll headlines

The headline:

Kiwis want cannabis legalised – Herald Facebook poll

And in the text

An unscientific poll run on the NZ Herald Facebook page shows that the majority of New Zealanders want to see cannabis legalised.

The poll doesn’t show anything of the sort, because bogus polls can’t show anything of the sort.

According to the story there were about 15,500 ‘yes’ responses. A bogus poll doesn’t tell you anything about people who didn’t participate. Even if we knew these were different people and all New Zealanders, it would still be just under half a percent of, say, enrolled voters.

It was just a few months ago that Nicholas Jones in the Herald reported a real poll, which asked a more detailed set of questions and tried to sample a representative group of people.  That adds information to the debate. Headlines based on bogus polls subtract information.

Briefly

  • “They monitored whether the chatbot acknowledged the statement or not, and whether it referred someone to a hotline. Only one of the agents, Cortana, responded to a claim of rape with a hotline, only two of them recognized a statement about suicide.”  From freedom-to-tinker
  • China is building the world’s most powerful facial recognition system with the power to identify any one of its 1.3 billion citizens within three seconds.South China Morning Post
  • “Pornhub announced that it is using machine learning and facial recognition“. They say it’s to improve search, according to Vice, which is more or less why people are worried.
  • From the Herald: “ACC has paid out on 660 claims where (pedestrian) cellphone distraction has been noted as the injury’s cause.”  You, of course, are asking what that comes to as a percentage of car crash costs. Outsourced to @aw_nz on Twitter
October 13, 2017

Road deaths up

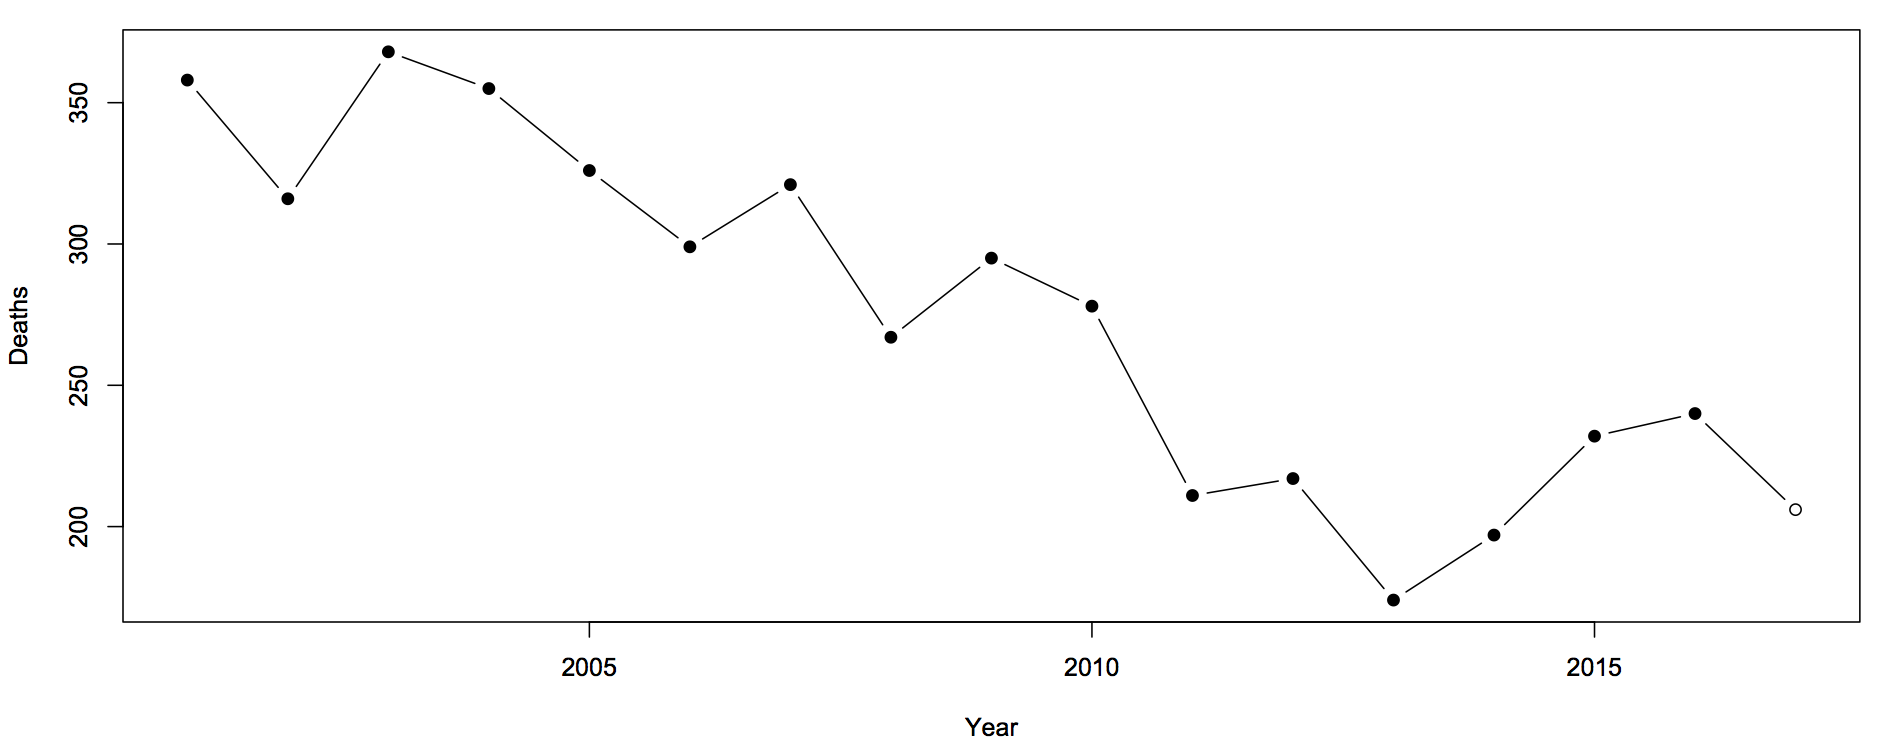
Sam Warburton (the economist, not the rugby player) has been writing about the recent increase in road deaths. Here are the counts (with partial 2017 data)
road-1

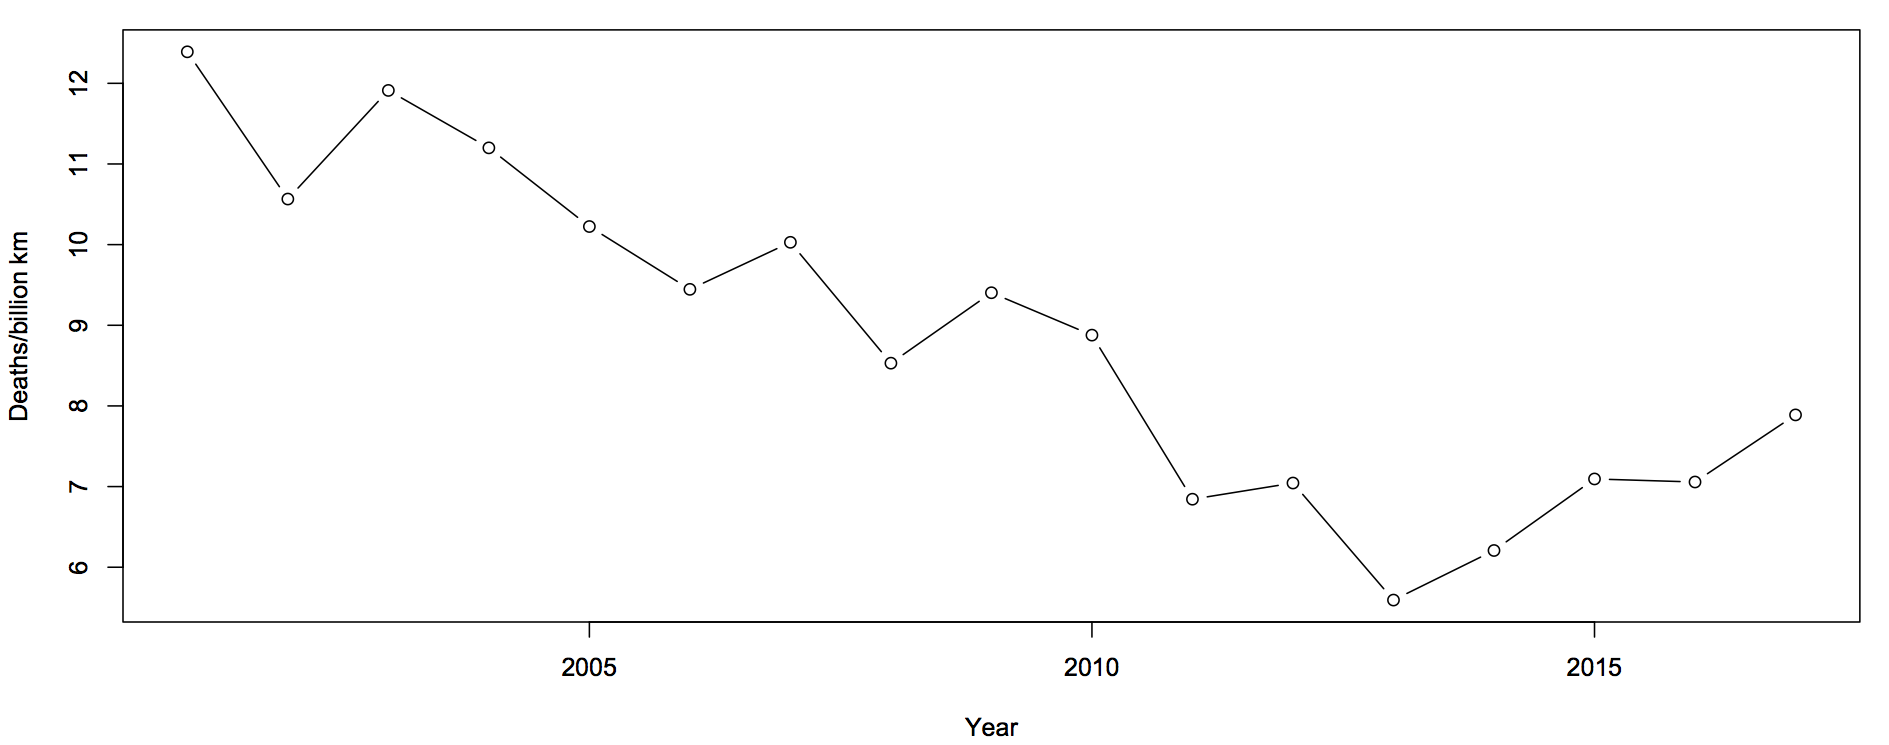
The first question you should ask is whether this is explained by population increases or by driving increases. That is, we want rates — deaths per unit of distance travelled
roads-2

There’s still an increase, but now the 2017 partial data are in line with the increase. The increase cannot be explained simply by more cars being on the roads.

The next question is about uncertainty.  Traditionally, news stories about the road toll were based on one month of data and random variation could explain it all. We still need a model for how much random variation to expect.  What I said before was

The simplest mathematical model for counts is the Poisson process.  If dying in a car crash is independent for any two people in NZ, and the chance is small for any person (but not necessarily the same for different people) then number of deaths over any specified time period will follow a Poisson distribution.    The model cannot be exactly right — multiple fatalities would be much rarer if it were — but it is a good approximation, and any more detailed model would lead to more random variation in the road toll than the Poisson process does.

In that case I was arguing that there wasn’t any real evidence of a change, so using an underestimate of the random variation made my case harder. In this case I’m arguing the change is larger than random variation, so I need to make sure I don’t underestimate random variation.

What I did was fit a Bayesian model with two extra random components.  The first was the trend over time. To avoid making assumptions about the shape of the trend I just assumed that the difference between adjacent years was relatively small and random. The second random component was a difference between the trend value for a year and the ‘true’ rate for that year. On top of all of that, there’s Poisson variation.  Since the size of the two additional random components is estimated from the data, they will capture all the variation.
roads-3

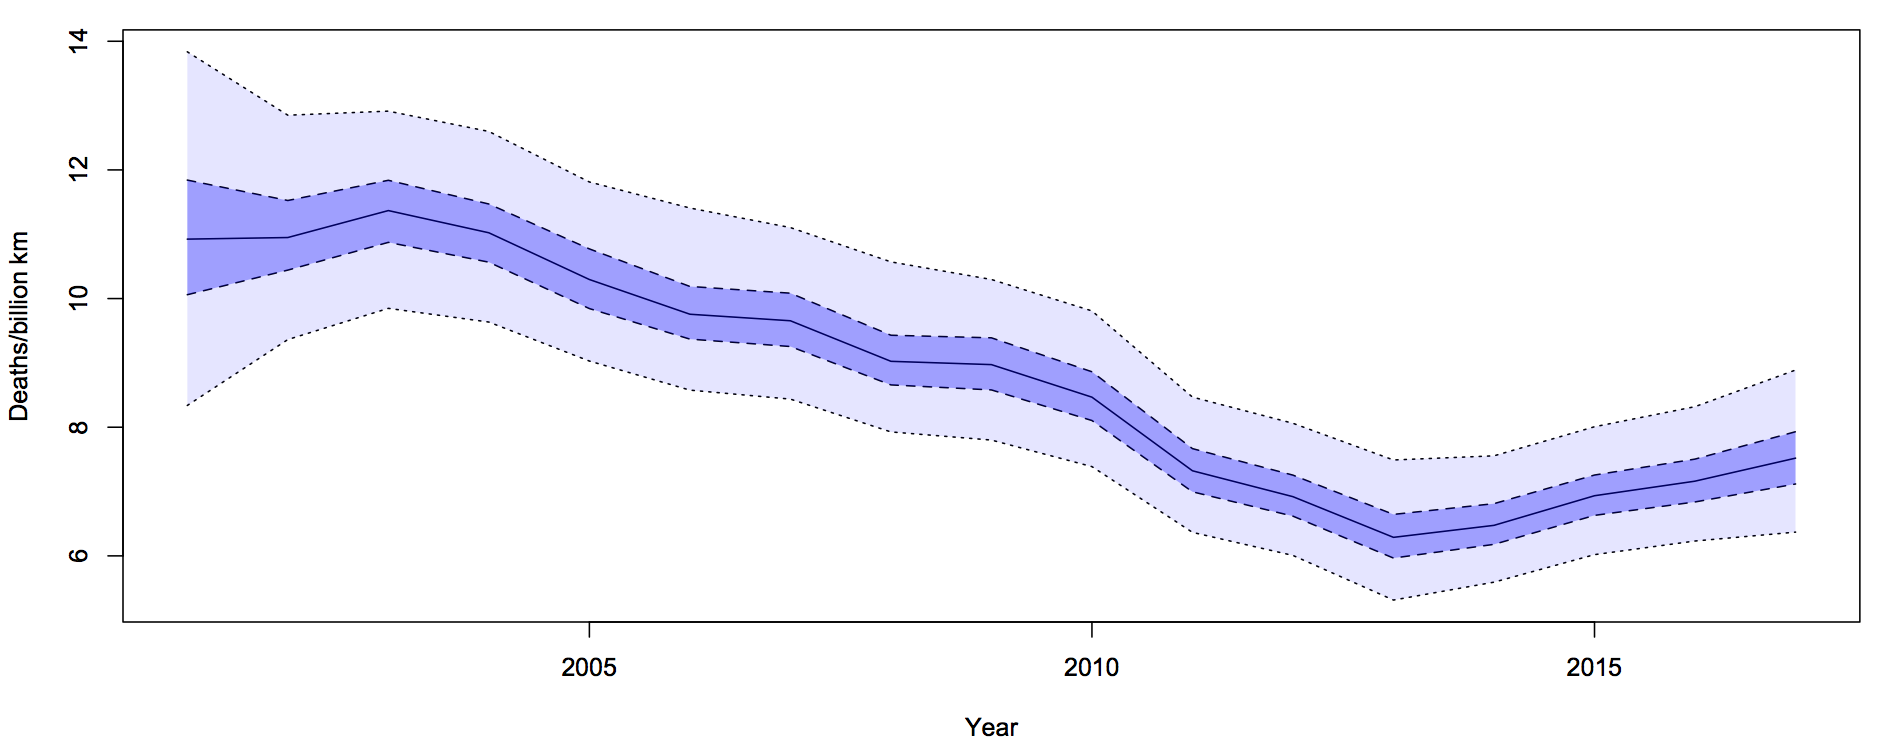
For each year, there is a 50% probability that the underlying rate is in the darker blue interval, and a 95% probability it’s in the light blue interval.  The trend is smoother than the data because the data has both the Poisson variation and the extra year-specific deviation. There’s more uncertainty in 2001 because we didn’t use pre-2001 data to tie it down at all, but that won’t affect the later half of the time period much.

It looks from the graph as though there was a minimum in 2013-14 and an increased rate since then.  One of the nice things about these Bayesian models is that you can easily and meaningfully ask for the probability that each year was the minimum. The probability is 54% for 2013 and 27% for 2014: there really was a minimum around then.

The probability that the rate is higher in 2017 than in 2013 is over 90%. This one isn’t just random variation, and it isn’t population increase.


Update: Peter Ellis, who has more experience with NZ official statistics and with Bayesian state-space time series models, gets qualitatively similar results

October 10, 2017

Avocado is the new chocolate

Q: Did you see “Just one extra banana or avocado a day could prevent heart attacks and stroke”

A: Hmm.

Q: It’s the potassium

A: Uhuh

Q: New Research Suggests

A: The effects of higher-potassium foods on blood pressure aren’t ‘new research’.  Look at what the American Heart Association says, or Harvard Health.

Q: Those sites don’t mention avocados, though. Is that what was new about the research?

A: No, that’s probably to meet the day’s quota for avocado stories.

Q: But at least the health message is real? They quote the researcher “The findings demonstrate the benefit of adequate potassium supplementation on prevention of vascular [hardening]”. With proper brackety things like we tell students to use.

A: We might prefer students to quote the rest of the clause , as the story does later: “demonstrate the benefit of adequate potassium supplementation on prevention of vascular calcification in atherosclerosis-prone mice” (emphasis added)

Q: So it probably wasn’t bananas, either.

A: No, high-cholesterol, high fat mouse food with high or low potassium.

Q: But the high-potassium mice lived longer? They had fewer heart attacks and strokes?

A: This is a lab experiment. It’s never going to end well for the mice. But they had stretchier arteries while they were alive.

Q: So what was the point, if we already knew higher-potassium diets with lots of fruit and veg are good for blood pressure?

A: The point was to find out how it works — which genes and proteins and so on.

Graphic of the week

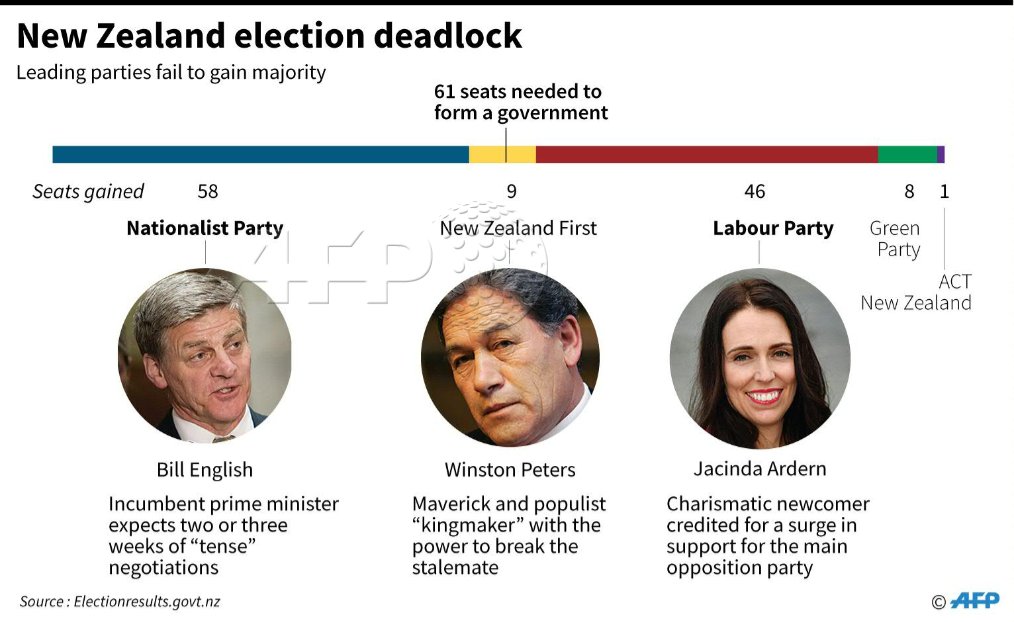
From the world’s third-largest news agency:

afp

  1. The Nationalist Party?
  2. National got 56 seats, not 58 — the graph seems to have the National results from the provisional count but the Labour and Green results from the final count
  3. NZ First doesn’t use yellow
  4. ACT, on the other hand, does.
  5. But ACT is relatively unlikely to enter a left-wing coalition with Labour and the Greens
October 9, 2017

Briefly

  • NY Times piece on personal genetic testing. (Disclaimer: I’m doing some consulting for a personal genomics company)
  • Where Americans get their science news and how much they trust various sources, from Pew Research.
  • “The Subjects Planned for the 2020 Census and American Community Survey report released today inadvertently listed sexual orientation and gender identity as a proposed topic in the appendix,” the U.S. Census Bureau said in a statement to NBC News. “This topic is not being proposed to Congress for the 2020 Census or American Community Survey”
  • ” It’s no longer good enough to shrug off (“briefly,” “for a small number of queries”) the problems in the system simply because it has computers in the decision loop.”
  • Road deaths are up since 2013.  Contrary to what the NZTA spokesperson says, it can’t be explained by increases in cars on the road: there has been a change in the trend for deaths per unit distance travelled.
  • Voting is now open for NZ Bird of the Year.  StatsChat doesn’t usually endorse bogus polls, but this one admits it’s just a publicity stunt.
October 5, 2017

Strength of evidence and type of evidence

The last 127 people to win a Nobel Prize for Physics have been men. Various people have calculated probabilities for this under a model where the true probability each time is 50:50.  Those probabilities are very small: they start with 37 zeros. Now, as people who analyse coincidences will tell you, there’s potential for cherry-picking. Gender of Nobel Laureates in Physics isn’t the only possible comparison.  On the other hand, if the comparison were picked from a thousand million billion trillion competing comparisons, the probability would still be tiny. The hypothesis that the committee chooses people at random for the Nobel Prize in Physics is not statistically defensible.  In fact, even the hypothesis that the committee chooses people with physics PhDs at random isn’t statistically defensible.

The reason there’s still controversy is that ‘choosing people at random’ isn’t anyone’s claim about how the Nobel Prize in Physics works.  Roughly speaking, there are three explanations for it just being given to women:

  1. Physics is too hard for women, who should just stick to biostatistics
  2. Women don’t get many opportunities to lead really ground-breaking physics research, because science is sexist
  3. The Nobel Committee for Physics (or the people eligible to nominate) are less likely to choose women who have contributed just as much

The p-value with a ridiculous number of zeros doesn’t provide any basis for assessing how important the three explanations are.  You need more data — and a different type of data.

So, for example, it’s relevant that Lise Meitner was nominated 29 times for the prize (and 19 times for the Chemistry prize) and didn’t win, but that Otto Hahn did win for their joint work. It’s relevant that Chieng-Shieng Wu was nominated 7 times and that a prize was awarded for the discovery she worked on. It’s relevant that Vera Rubin received lots of other prizes and awards and was routinely mentioned as a possible Nobelist — we don’t yet know how often she was nominated because there’s a 50-year secrecy rule.

Personally (though I’m not a physicist) I think that explanation 1 can be largely discounted and explanation 2 has to stretch a lot to cover the situation, so explanation 3 is looking plausible. But the numbers with 37 zeroes aren’t a relevant summary of the data.

October 4, 2017

Briefly

  • Data leakage: Bluetooth sex toys do not have a good sense of what’s a private activity (probably NSFW)
  • “Science in Society” award winners from the (US) National Association of Science Writers
  • The Nobel Prize for Physics went to gravitational wave astronomy. That’s a more statistical area than usual — extracting minute gravitational-wave signals from the background noise is a statistical challenge as well as an engineering nightmare. Renate Meyer, from the UoA Statistics department, and her co-workers, did some of the early work on this problem, and Matt Edwards (who we’re hoping to get back after a postdoc overseas) is a member of the LIGO Consortium.

Slip, slop, slap

From Stuff, the front-page link:

sun

As Betteridge’s Law of Headlines implies, the answer is “No.” Even the vendor doesn’t make a claim like that.

The story says (with the advertising redacted)

The key ingredient in the capsules is 100mg of … a blend of grapefruit and rosemary extracts. An independent lab trial of [the stuff] in Italy in 2015 found the onset of sunburn was delayed by 30 percent after two months of daily use.

It appears to be still-unpublished study. According to an advertising white paper,  it’s actually better than a lot of nutraceutical research: it was blinded and had 35 people in each group.  If we assume there aren’t any hidden problems, the study says that people who take this stuff daily for a couple of months end up needing about 30% more UV light to get a mild sunburn.

That is, the optimistic view is we’re looking at the equivalent of SPF 1.3 sunscreen.

October 2, 2017

Denominators (when cellphones attack)

A question that is very unlikely to be interesting: were there more cellphone-related injuries in Dunedin or Auckland last year?

Auckland has a lot more people. Of course it has more cellphone-related injuries.

A question that is moderately unlikely to be interesting, but, ok, you might need to write a story: were people in Auckland more likely to have cellphone-related injuries than people in Dunedin?

So, where the Herald website (and presumably the ODT originally) has

In the three years to the end of 2016, ACC received 23 claims for cellphone injuries from Dunedin people and paid claimants a total of $10,436…

Statistics provided by ACC show Aucklanders made the highest number of claims at 190, costing a total of $76,159

the second paragraph might be better as

Although Auckland has more than ten times as many people, the home of the Vodafone Warriors had only 190 claims, costing a total of $76,159

(Someone who can actually write might do better than me here. )