Transport numbers
Auckland Transport released new patronage data, and FigureNZ tidied it up to make it easily computer-readable, so I thought I’d look at some of it. What I’m going to show is a decomposition of the data into overall trends, seasonal variation, and random stuff just happening. As usual, click to embiggen the pictures.
First, the trends: rides are up.
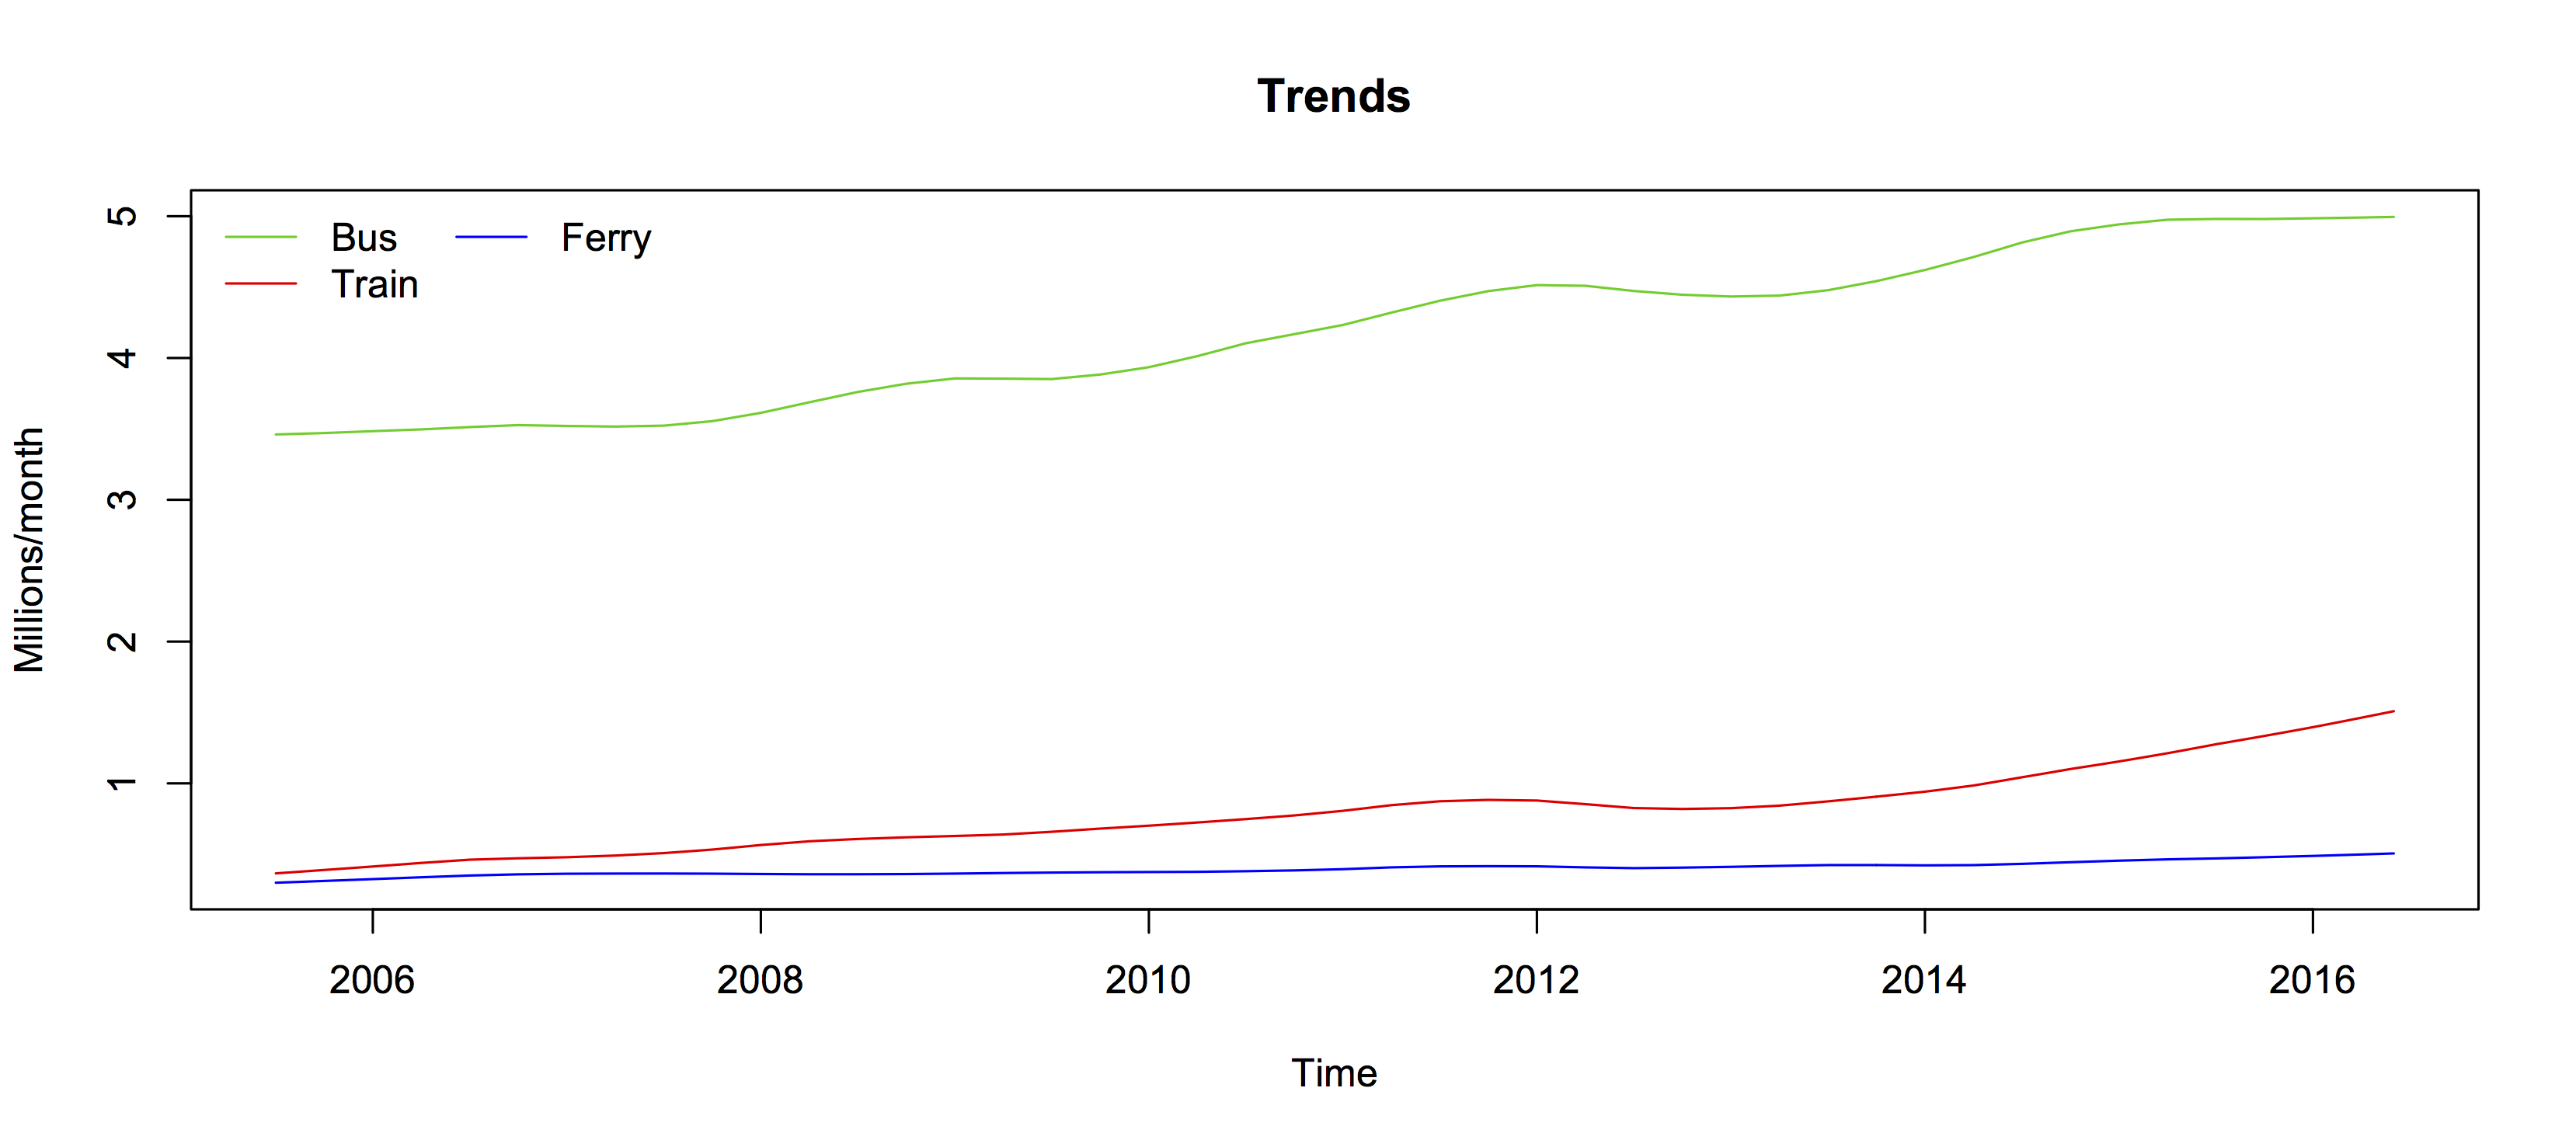
It’s hard to see the trend in ferry use, so here’s a version on a log scale — meaning that the same proportional trend would look the same for all three modes of transport
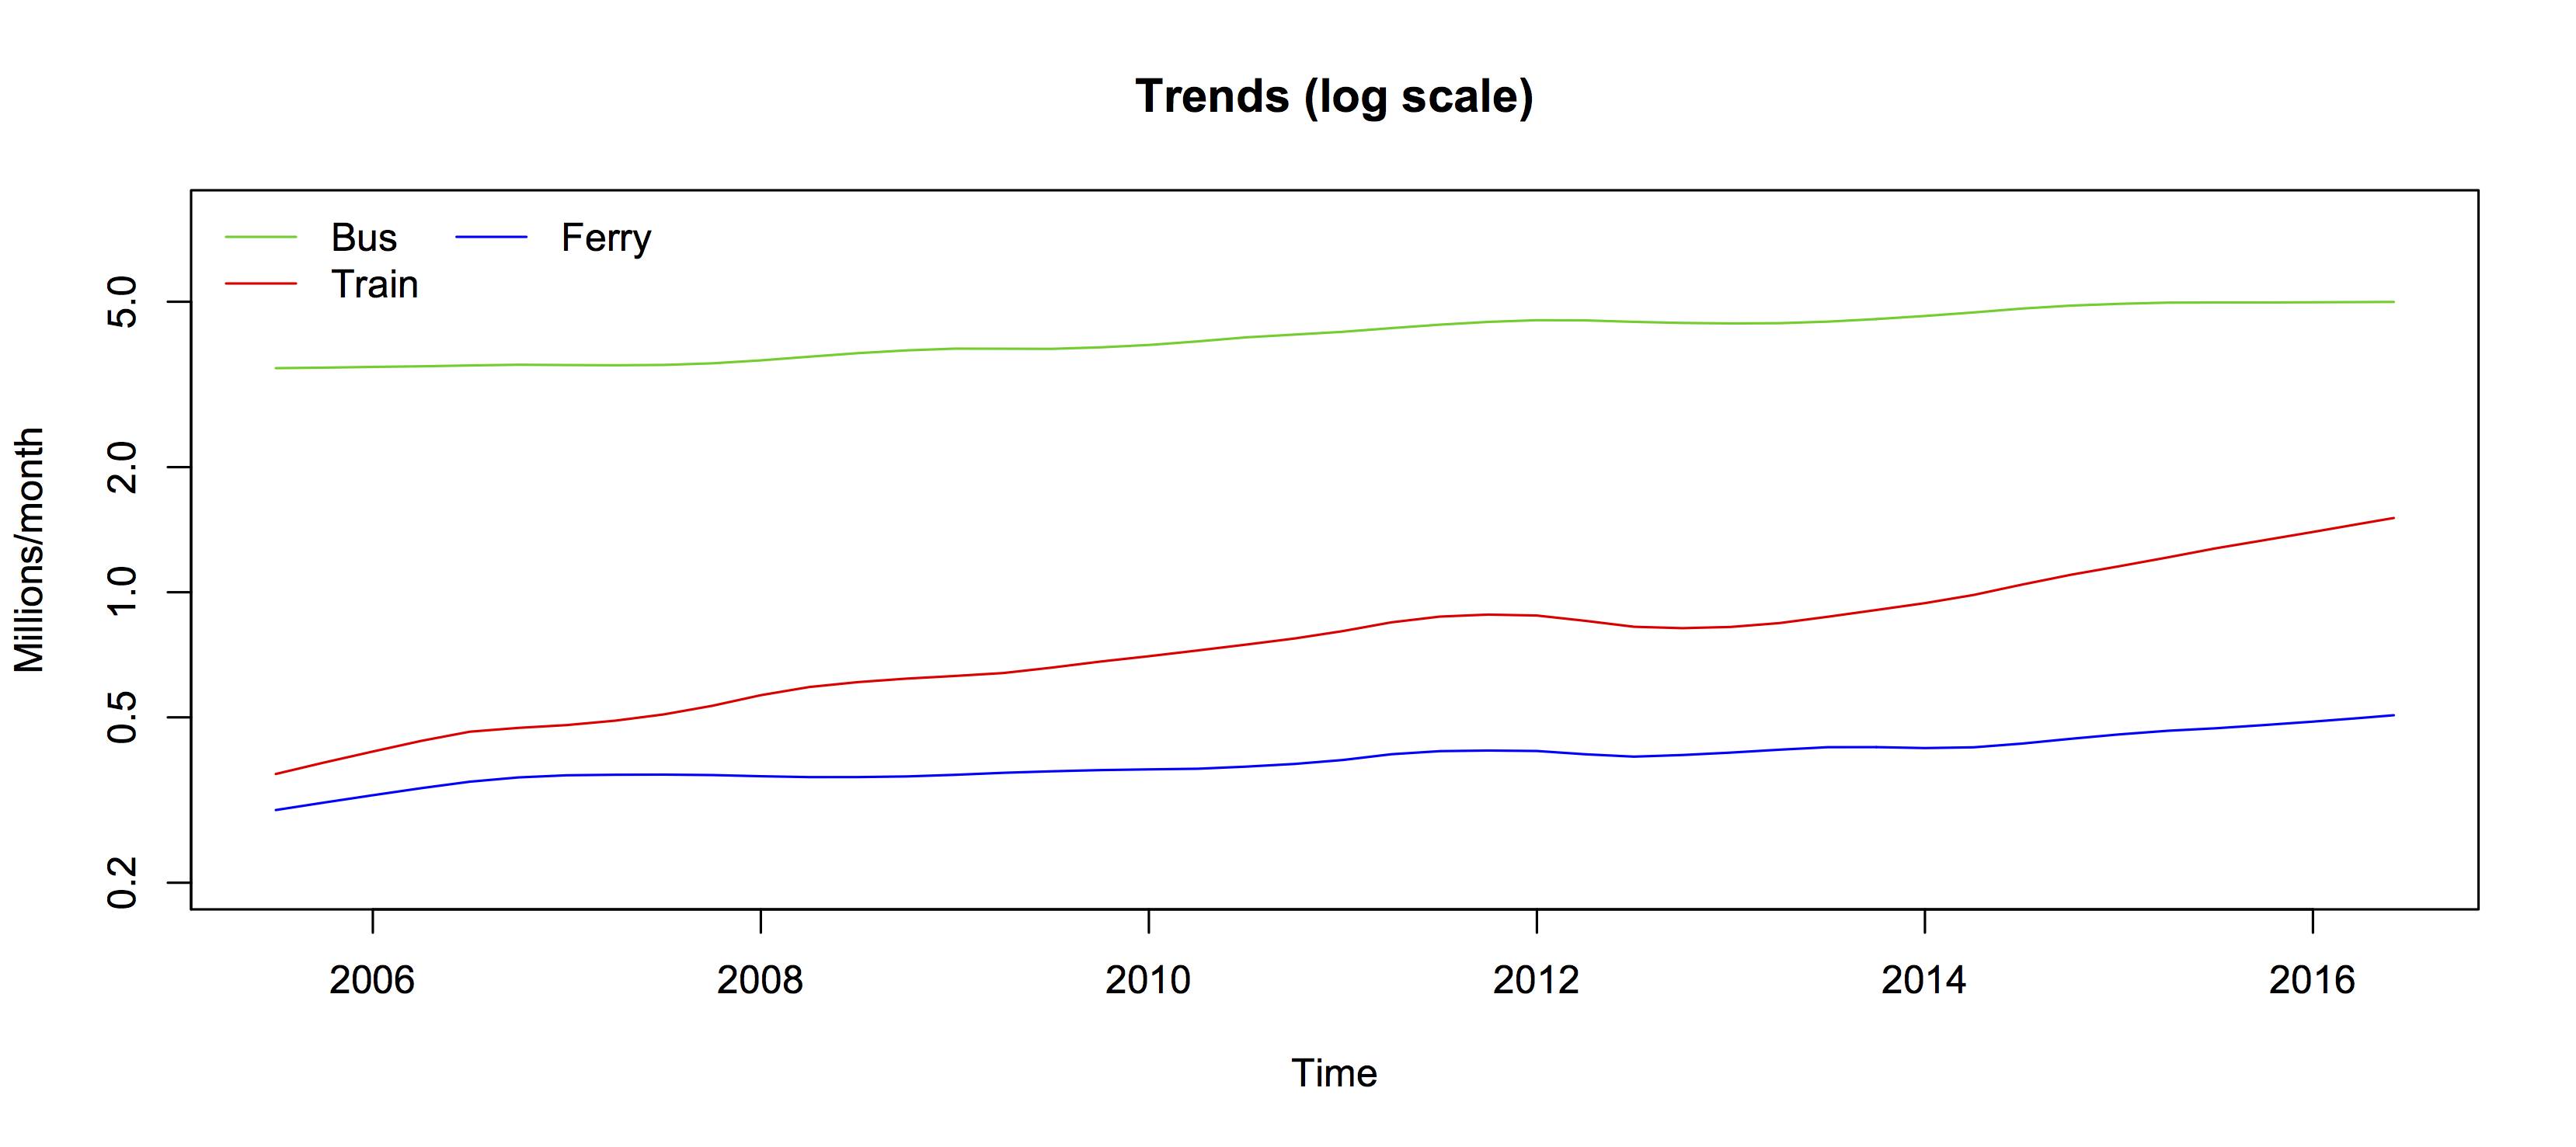
Train use is increasing (relatively) faster than bus or ferry use. There’s also an interesting bump in the middle that we’ll get back to.
Now, the seasonal patterns. Again, these are on a logarithmic scale, so they show relative variation
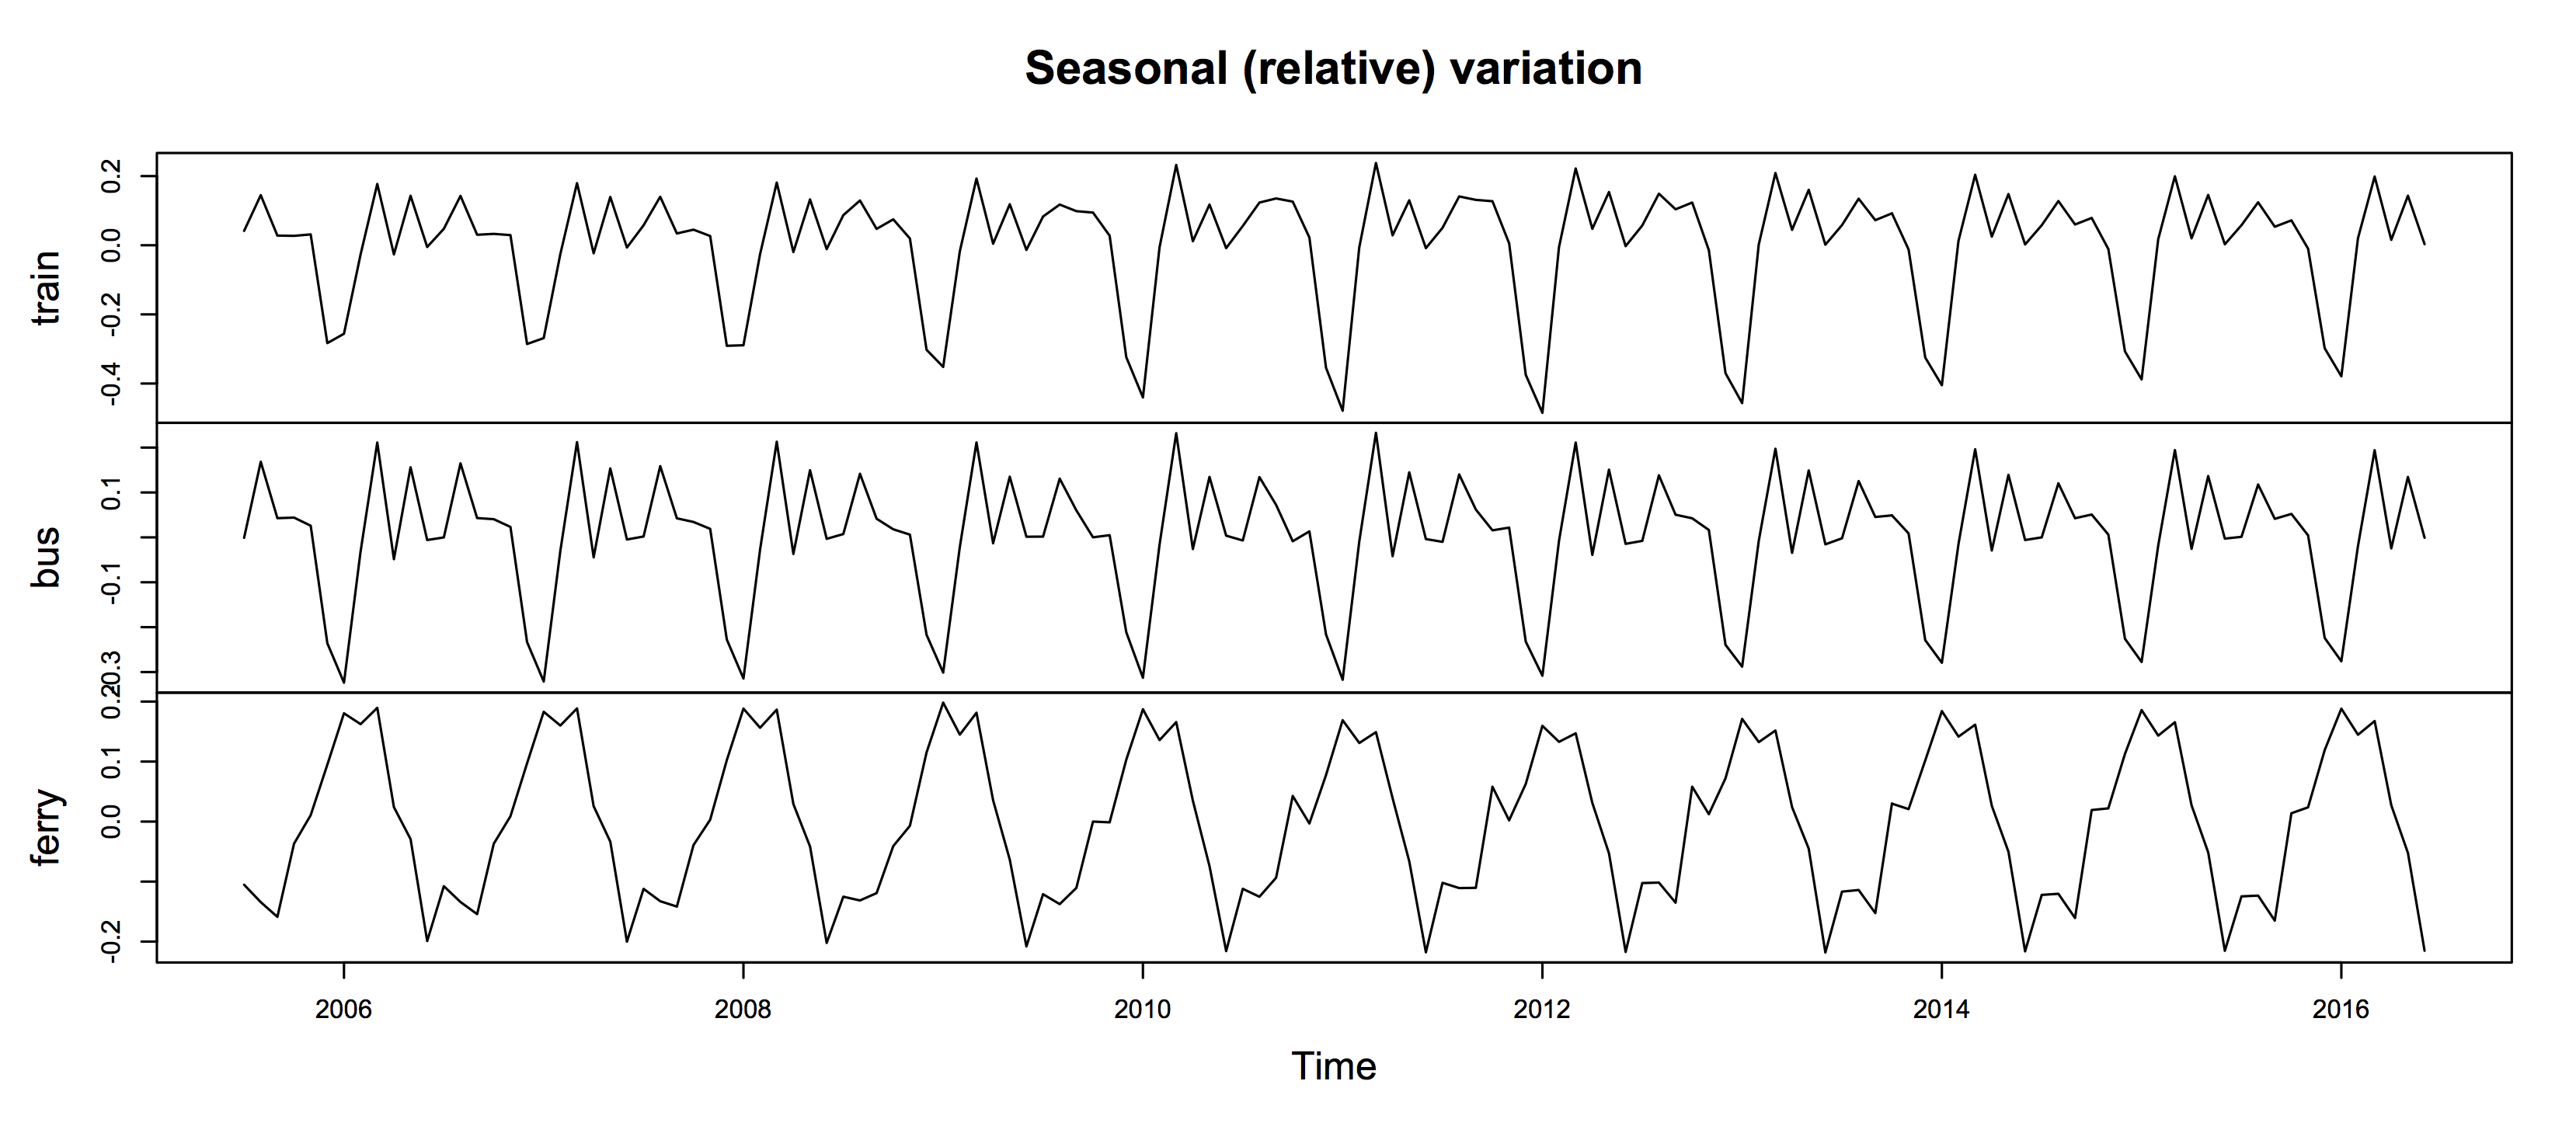
The clearest signal is that ferry use peaks in summer, when the other modes are at their minimum. Also, the Christmas minimum is a bit lower for trains: to see this, we can combine the two graphs:
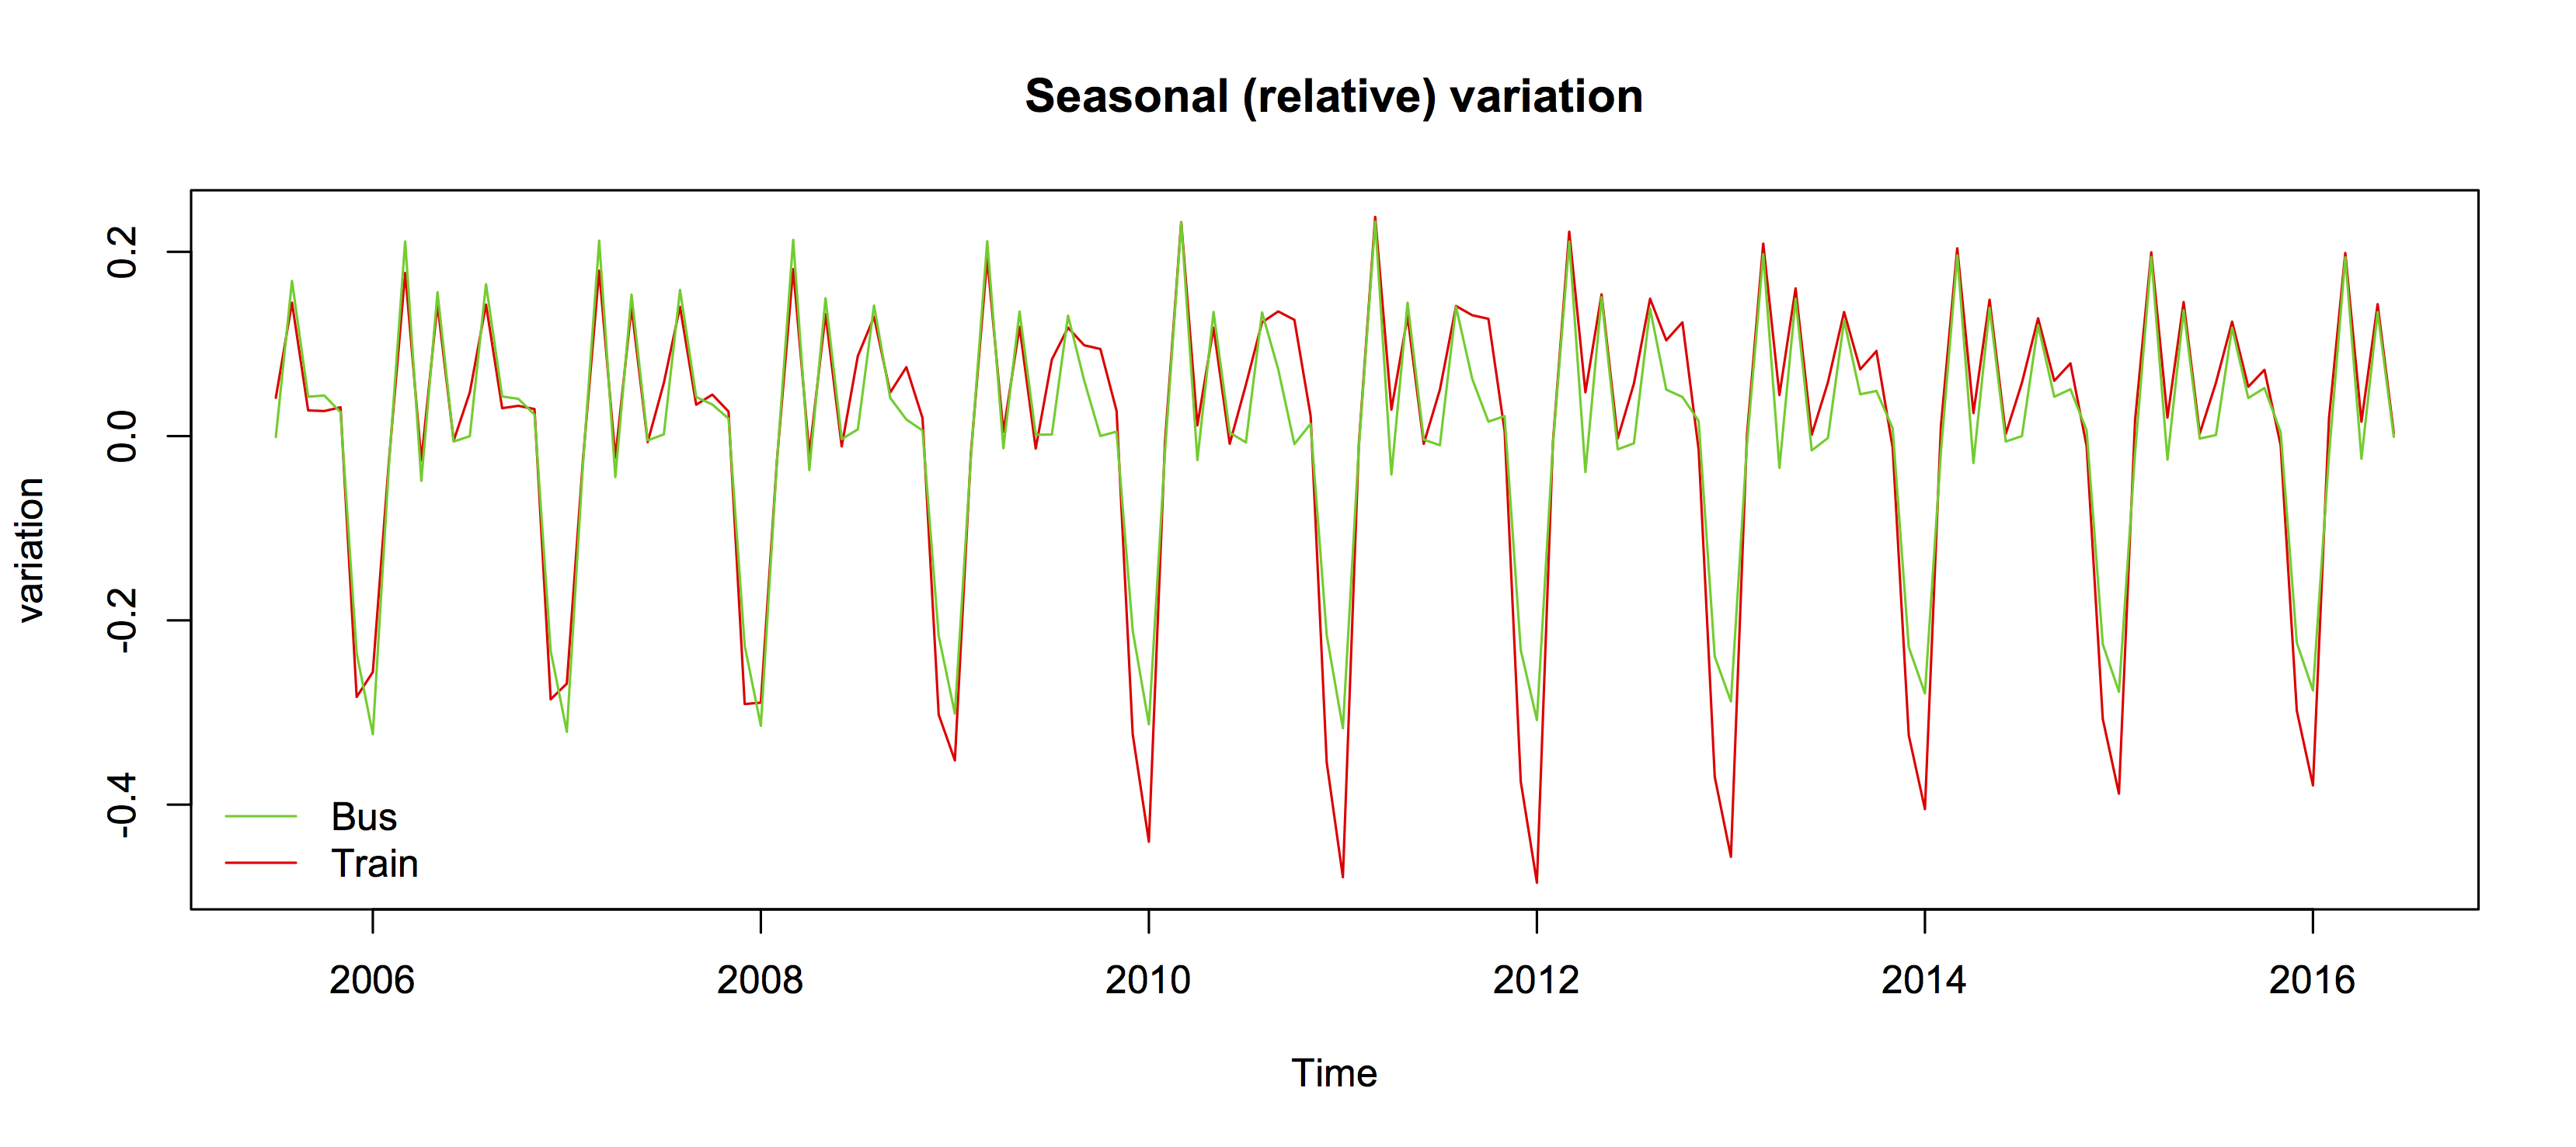
It’s not surprising that train use falls by more: they turn the trains off for a lot of the holiday period.
Finally, what’s left when you subtract the seasonal and trend components:
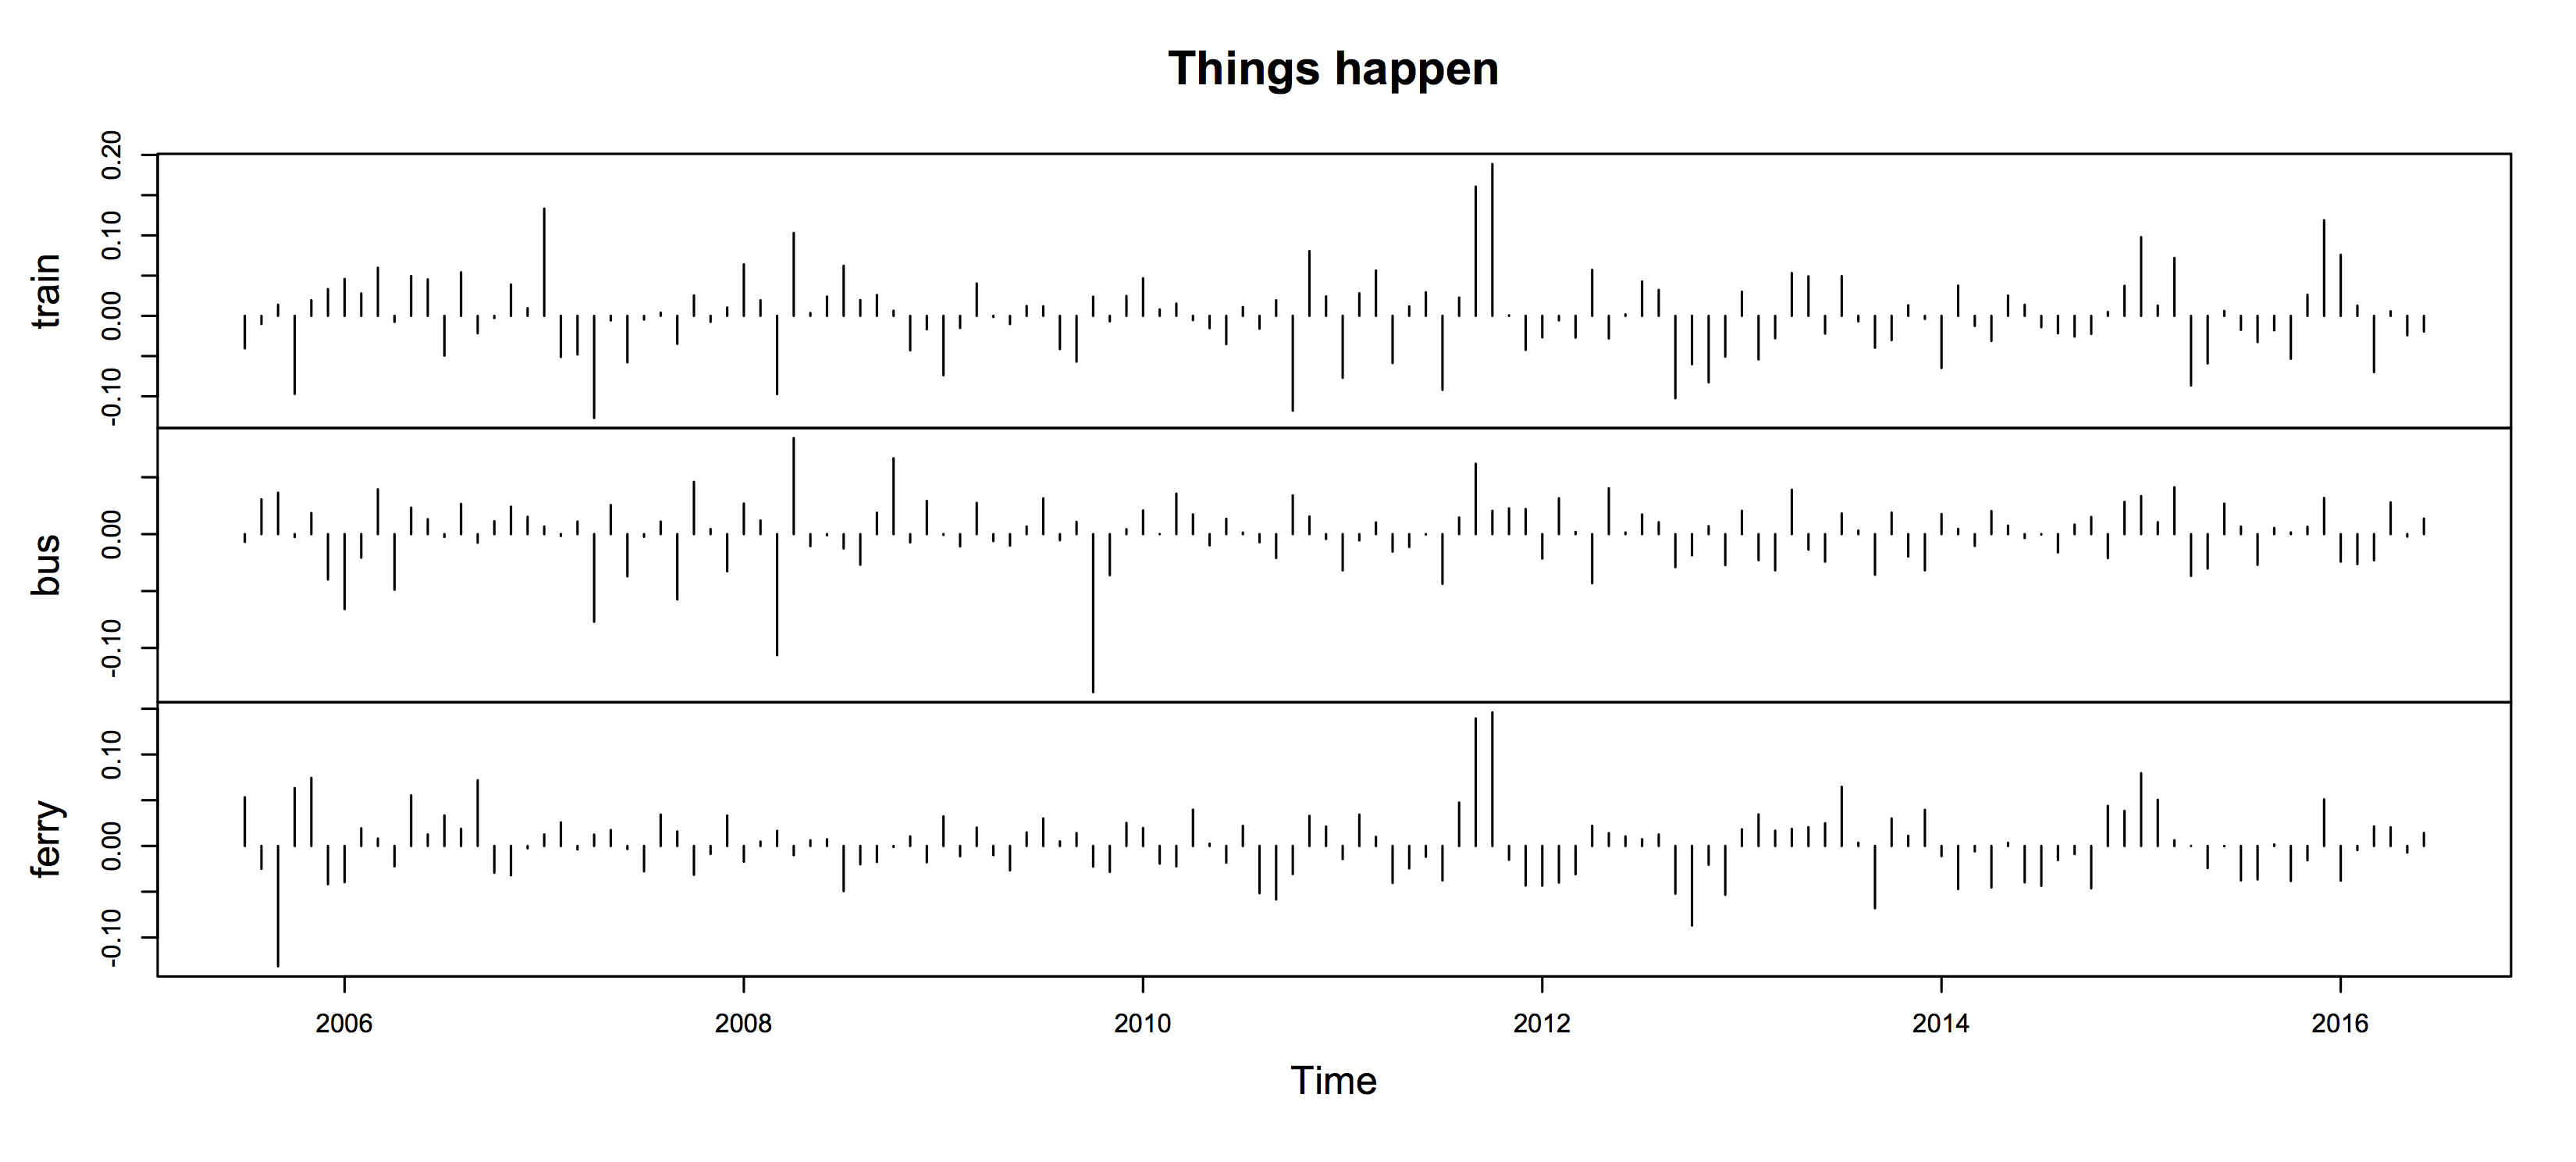
The highest extra variation in both train and ferry rides was in September and October 2011: the Rugby World Cup.
Thomas Lumley (@tslumley) is Professor of Biostatistics at the University of Auckland. His research interests include semiparametric models, survey sampling, statistical computing, foundations of statistics, and whatever methodological problems his medical collaborators come up with. He also blogs at Biased and Inefficient See all posts by Thomas Lumley »
Ferry use goes up in the Summer because of the Cruise Ships. The tourists all go to Devonport or Waiheke for the day. One has docked in the last day so the Ferry has been chocker.
8 years ago