Is there a 3-strikes law for piecharts?
The Herald-Sun pie chart saga continues (thanks to @danfairbairn and @PeteHaitch on Twitter). Can we get their piechart license suspended pending training and re-examination?
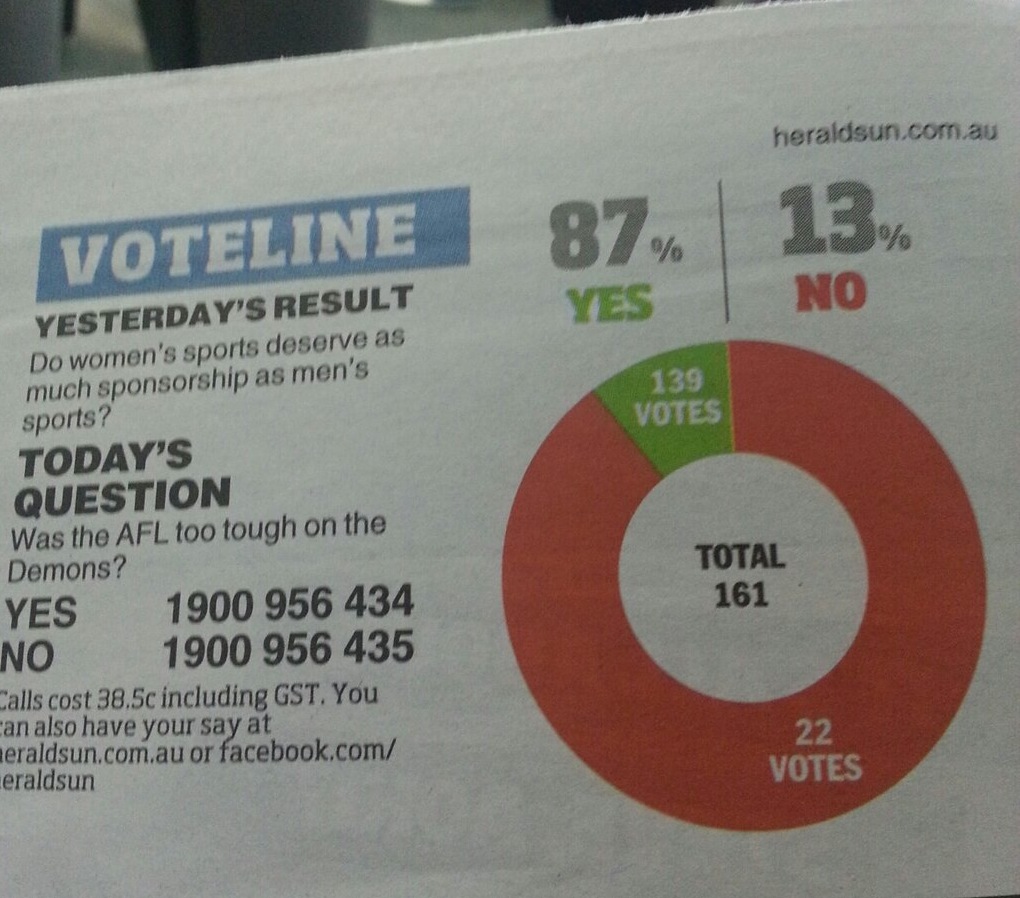
This example further complicates the question of how they actually make these graphs. In this one, the angle is at least approximately right, the percentages are right apart from being incorrectly rounded, but the graph is backwards. We’ve also seen examples where the angles were completely wrong, but the two groups were correctly identified. It’s hard to see how an automated system could cause such a bewildering variety of problems, but it’s also hard to see how a real person could be so totally clueless about pie charts.
Thomas Lumley (@tslumley) is Professor of Biostatistics at the University of Auckland. His research interests include semiparametric models, survey sampling, statistical computing, foundations of statistics, and whatever methodological problems his medical collaborators come up with. He also blogs at Biased and Inefficient See all posts by Thomas Lumley »
Sounds like a fun inference problem. Given these three pie charts, infer what it is that they think they’re doing.
13 years ago
Actually, the percentages round to 14% and 86%!
Pretty minor quibble in the scheme of things!
13 years ago
“but it’s also hard to see how a real person could be so totally clueless about pie charts”.
If you familiarise yourself with the Herald Sun’s general standard of journalism you’ll find it easier to believe.
13 years ago