April 27, 2013
Facebook data analysis and visualisation
From the Stephen Wolfram blog, lots of analysis of Facebook friend data with well-designed graphs. For example, this graph shows how the mean age of your `friends’ is related to your age.
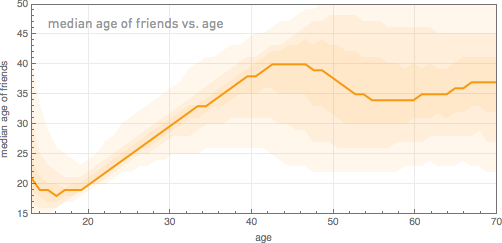
Those under 40 have Facebook friends of about the same age, but after than the age distribution levels off and becomes much more variable.
Thomas Lumley (@tslumley) is Professor of Biostatistics at the University of Auckland. His research interests include semiparametric models, survey sampling, statistical computing, foundations of statistics, and whatever methodological problems his medical collaborators come up with. He also blogs at Biased and Inefficient See all posts by Thomas Lumley »
This is really interesting. I realize that there is probably too much variation to say for certain, but I would hypothesize that the dip after the mid-40s to a low around 55 is real. I reckon that before the dip you friend others of the same age (your peers), but then as you get older, you friend your kids. This also explains why there is a higher median age right at the bottom left corner of the graph. Might be fun to test this…
11 years ago
The other day on NatRad they were talking about how Facebook is loosing some of the young adult demographic as their parents hop on-line and “friend” them … and then find out about their children’s social lives …
I’m not on Facebook but aren’t you supposed to be 13 or older to join?
11 years ago