Posts filed under Social Media (95)

January 31, 2019

Meet Statistics summer scholar Grace Namuhan

Every summer, the Department of Statistics offers scholarships to high-achieving students so they can work with staff on real-world projects. Grace Namuhan, below, is working with Professional Teaching Fellow Anna Fergusson on the design of interactive data visualisation tools for large classes.

Stage one Statistics courses are enormously popular at the University of Auckland – there are more than 2,000 students per semester, and single lectures may contain up to 600 students. Anna Fergusson, who is part of the stage one teaching team, is a keen developer of in-class web apps to engage these students. For example, you might get students to respond to questions via their own devices, with the data collected to a Google sheet that can then be analysed in class. Working alongside Anna, Grace has been exploring the principles of designing such data visualisation interactives for large-scale learning.

In particular, she is working on an interactive to collect finer-grained data on how students carry out a hypothesis test – in particular, a Chi-square test for independence. This particular app is not for live analysis – rather, she is tracking every point, click, and selection students make as they work through the interactive.

She’s had to work out what data to collect and how to store it, and also develop a plan to analyse this very rich and complex data set – even this one app involves thousands and thousands of rows of data. She also has to consider what an educator would want to know from the data.

Grace, a third-year Bachelor of Science student undergraduate majoring in Data Science, says the project is exercising what she has learned so far, “which are my programming skills for creating the interactive and statistical skills for analysing the information extracted from the interactive”.

However, Grace didn’t start out her undergraduate studies in statistics – she did a year of biomedical science “but I didn’t really enjoy it. Data science just came out as a new major when I wanted to change my major – it involves half statistics courses and half computer science courses, so I thought it would be a really suitable major for me.”

Statistics appeals to Grace as she is “quite a practical person; turning what might look meaningless data into something useful is really fascinating. There are a lot of invisible data around us in our daily lives; being a data interpreter makes me feel like I am useful”.

  • For general information on University of Auckland summer scholarships, click here.
  • To find out more about Anna’s work in developing resources for large-class teaching, click here.
February 17, 2018

Read me first?

There’s a viral story that viral stories are shared by people who don’t actually read them. I saw it again today in a tweet from Newseum Insititute

If you search for the study it doesn’t take long to start suspecting that the majority of news sources sharing this study didn’t read it first.  One that at least links is from the Independent, in June 2016.

The research paper is here. The money quote looks like this, from section 3.3

First, 59% of the shared URLs are never clicked or, as we call them, silent.

We can expand this quotation slightly

First, 59% of the shared URLs are never clicked or, as we call them, silent. Note that we merged URLs pointing to the same article, so out of 10 articles mentioned on Twitter, 6 typically on niche topics are never clicked

That’s starting to sound a bit different. And more complicated.

What the researchers did was to look at bit.ly URLs to news stories from five major sources, and see if they had ever been clicked. They divided the links into two groups: primary URLs tweeted by the media source itself (eg @NYTimes), and secondary URLs tweeted by anyone else. The primary URLs were always clicked at least once — you’d expect that just for checking purposes.  The secondary URLs, as you’d expect, averaged fewer clicks per tweet; 59% were not clicked at all.

That’s being interpreted as if it were 59% of retweets didn’t involve any clicks. But it isn’t. It’s quite likely that most of these links were never retweeted.  And there’s nothing in the data about whether the person who first tweeted the link read the story: there certainly isn’t any suggestion that person didn’t read the story.

So, if I read some annoying story about near-Earth asteroids on the Herald and if tweeted a bit.ly URL, there’s a chance no-one would click on it. And, looking at my Twitter analytics, I can see that does sometimes happen. When it happens, people usually don’t retweet the link either, and it definitely doesn’t go viral.

If I retweeted the official @NZHerald link about the story, then it would almost certainly have been clicked by someone. The research would say nothing whatsoever about the chance that I (or any of the other retweeters) had read it.


February 2, 2018

Diagnostic accuracy: twitter followers

The New York Times and Stuff both have recent stories about fake Twitter followers. There’s an important difference. The Times focuses on a particular company that they claim sells fake followers; Stuff talks about two apps that claim to be able to detect fakes by looking at their Twitter accounts.

The difference matters. If you bought fake followers from a company such as the one the Times describes, then you (or a ‘rogue employee’) knew about it with pretty much 100% accuracy.  If you’re relying on algorithmic identification, you’d need some idea of the accuracy for it to be any use — and an algorithm that performs fairly well on average for celebrity accounts could still be wrong quite often for ordinary accounts. If you know that 80% of accounts with a given set of properties are fake, and someone has 100,000 followers with those properties, it might well be reasonable to conclude they have 80,000 fake followers.  It’s a lot less safe to conclude that a particular follower, Eve Rybody, say, is a fake.

Stuff says

Twitter Audit analyses the number of tweets, date of the last tweet, and ratio of followers to friends to determine whether a user is real or “fake”.

SocialBakers’ Maie Crumpton says it’s possible for celebrities to have 50 per cent “fake” or empty follower accounts through no fault of their own. SocialBakers’ labels an account fake or empty if it follows fewer than 50 accounts and has no followers.

Twitter Audit thinks I’ve got 50 fake followers. It won’t tell me who they are unless I pay, but I think it’s probably wrong. I have quite a few followers who are inactive or who are read-only tweeters, and some that aren’t real people but are real organisations.

Twitter users can’t guard against followers being bought for them by someone else but Brislen and Rundle agree it is up to tweeters to protect their reputation by actively managing their account and blocking fakes.

I don’t think I’d agree even if you could reliably detect individual fake accounts; I certainly don’t agree if you can’t.

April 3, 2017

How big is that?

From Stuff and the Science Media Centre

Dr Sean Weaver’s start-up business has saved over 7000 hectares of native rainforest in Southland and the Pacific

So, how much is that? I wasn’t sure, either.  Here’s an official StatsChat Bogus Poll to see how good your spatial numeracy is;

The recently ex-kids are ok

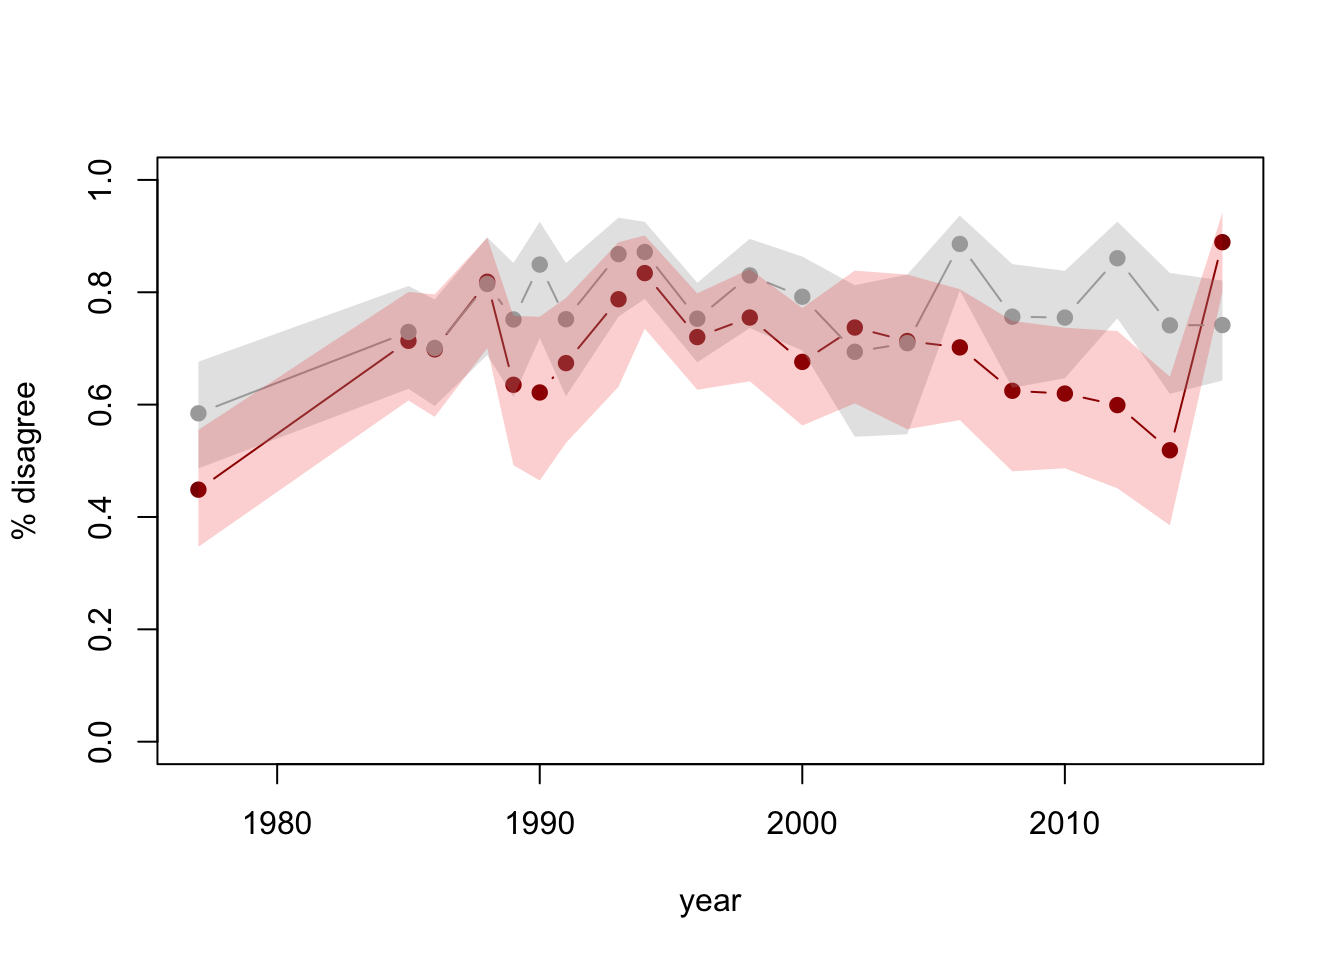
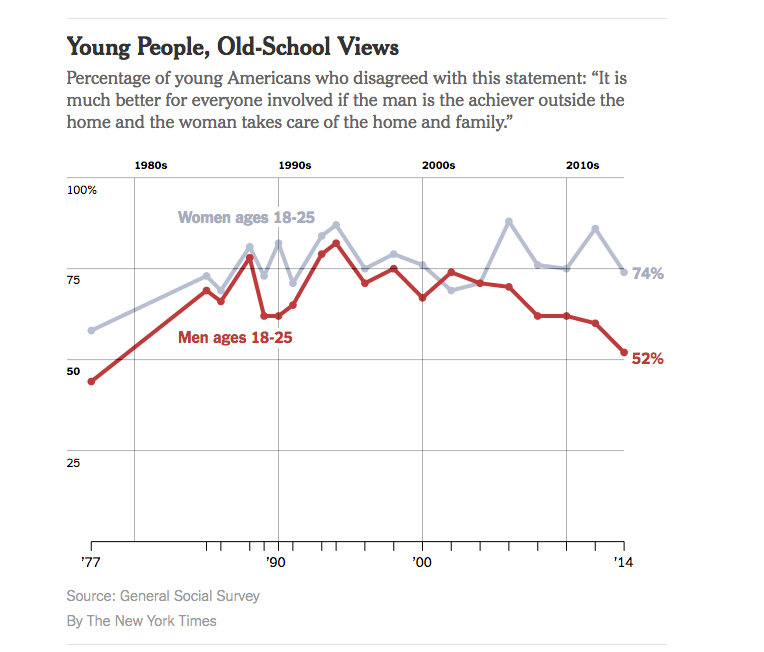
The New York Times had a story last week with the headline “Do Millennial Men Want Stay-at-Home Wives?”, and this depressing graphnyt

But, the graph doesn’t have any uncertainty indications, and while the General Social Survey is well-designed, that’s a pretty small age group (and also, an idiosyncratic definition of ‘millennial’)

So, I looked up the data and drew a graph with confidence intervals (full code here)

foo

See the last point? The 2016 data have recently been released. Adding a year of data and uncertainty indications makes it clear there’s less support for the conclusion that it looked.

Other people did similar things: Emily Beam has a long post  including some context

The Pepin and Cotter piece, in fact, presents two additional figures in direct contrast with the garbage millennial theory – in Monitoring the Future, millennial men’s support for women in the public sphere has plateaued, not fallen; and attitudes about women working have continued to improve, not worsen. Their conclusion is, therefore, that they find some evidence of a move away from gender equality – a nuance that’s since been lost in the discussion of their work.

and Kieran Healy tweeted


As a rule if you see survey data (especially on a small subset of the population) without any uncertainty displayed, be suspicious.

Also, it’s impressive how easy these sorts of analysis are with modern technology. They used to require serious computing, expensive software, and potentially some work to access the data.  I did mine in an airport: commodity laptop, free WiFi, free software, user-friendly open-data archive.   One reason that basic statistics training has become much more useful in the past few decades is that so many of the other barriers to DIY analysis have been removed.

March 8, 2017

Yes, November 19

trends

The graph is from a Google Trends search for  “International Men’s Day“.

There are two peaks. In the majority of years, the larger peak is on International Women’s Day, and the smaller peak is on the day itself.

November 26, 2016

Garbage numbers from a high-level source

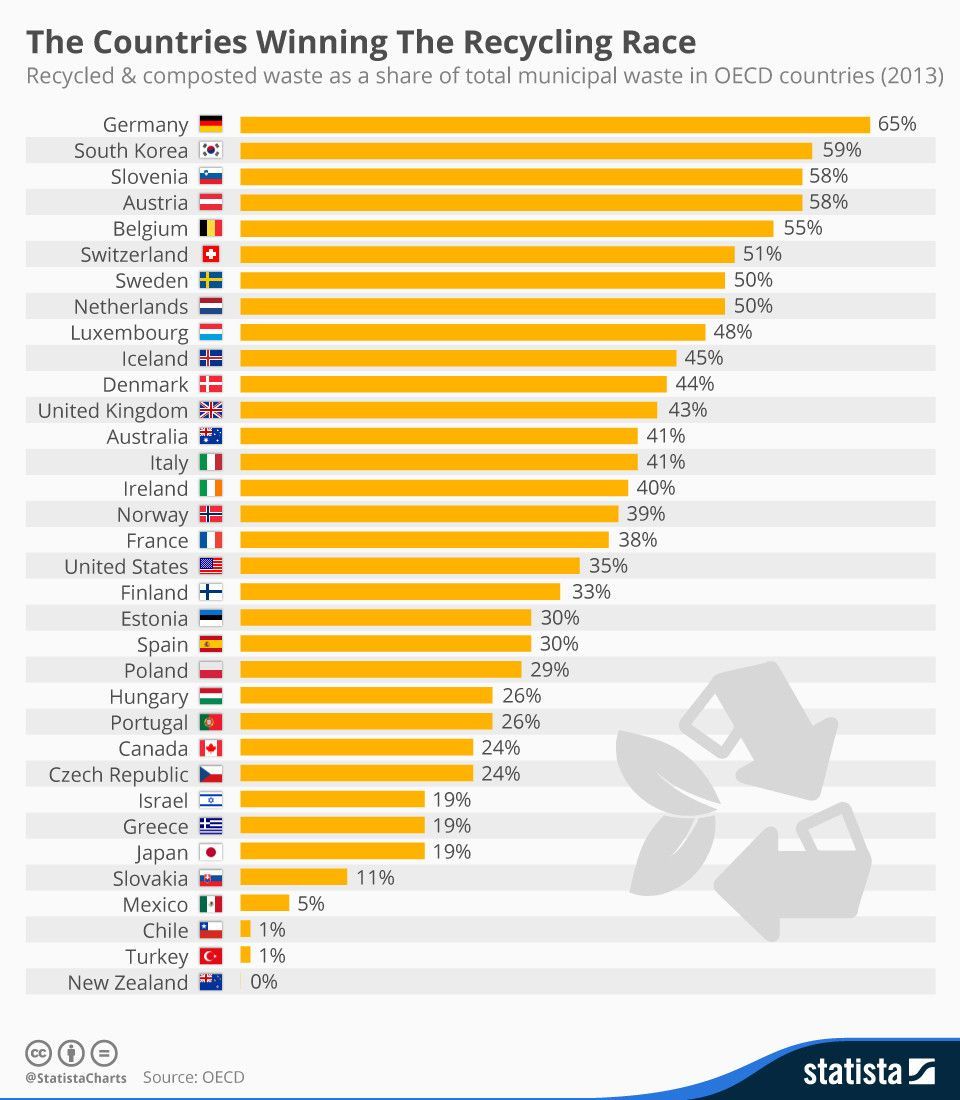
The World Economic Forum (the people who run the Davos meetings) are circulating this graph:cyjjcamusaaooga

According to the graph, New Zealand is at the bottom of the OECD, with 0% waste composted or recycled.  We’ve seen this graph before, with a different colour scheme. The figure for NZ is, of course, utterly bogus.

The only figure the OECD report had on New Zealand was for landfill waste, so obviously landfill waste was 100% of that figure, and other sources were 0%.   If that’s the data you have available, NZ should just be left out of the graph — and one might have hoped the World Economic Forum had enough basic cluefulness to do so.

A more interesting question is what the denominator should be. The definition the OECD was going for was all waste sent for disposal from homes and from small businesses that used the same disposal systems as homes. That’s a reasonable compromise, but it’s not ideal. For example, it excludes composting at home. It also counts reuse and reduced use of recyclable or compostable materials as bad rather than good.

But if we’re trying to approximate the OECD definition, roughly where should NZ be?  I can’t find figures for the whole country, but there’s some relevant –if outdated — information in Chapter 3 of the Waste Assessement for the Auckland Council Waste Management Plan. If you count just kerbside recycling pickup as a fraction of kerbside recycling+waste pickup, the diversion figure is 35%. That doesn’t count composting, and it’s from 2007-8, so it’s an underestimate. Based on this, NZ is probably between USA and Australia on the graph.

May 29, 2016

I’ma let you finish

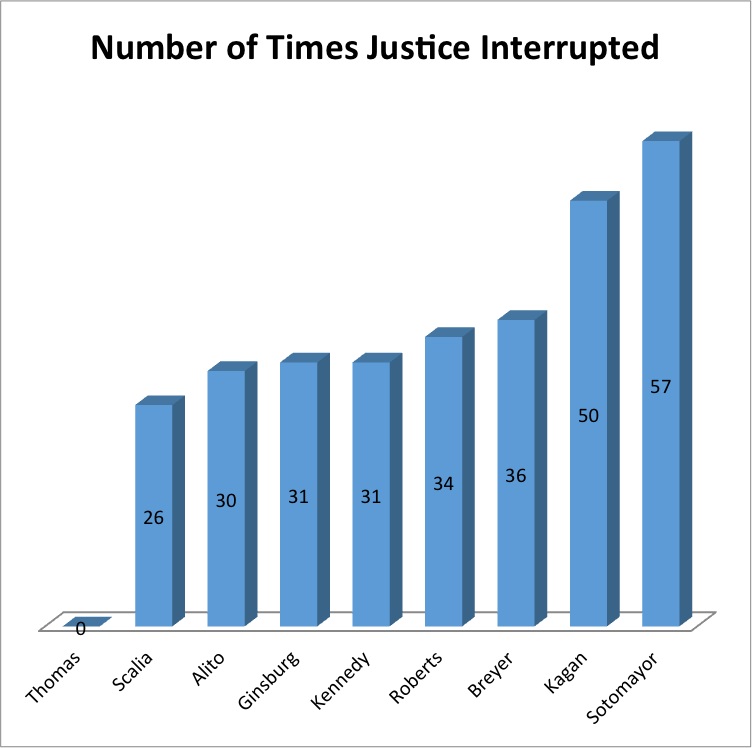
Adam Feldman runs the blog Empirical SCOTUS, with analyses of data on the Supreme Court of the United States. He has a recent post (via Mother Jones) showing how often each judge was interrupted by other judges last year:

Interrupted

For those of you who don’t follow this in detail, Elena Kagan and Sonia Sotomayor are women.

Looking at the other end of the graph, though, shows something that hasn’t been taken into account. Clarence Thomas wasn’t interrupted at all. That’s not primarily because he’s a man; it’s primarily because he almost never says anything.

Interpreting the interruptions really needs some denominator. Fortunately, we have denominators. Adam Feldman wrote another post about them.

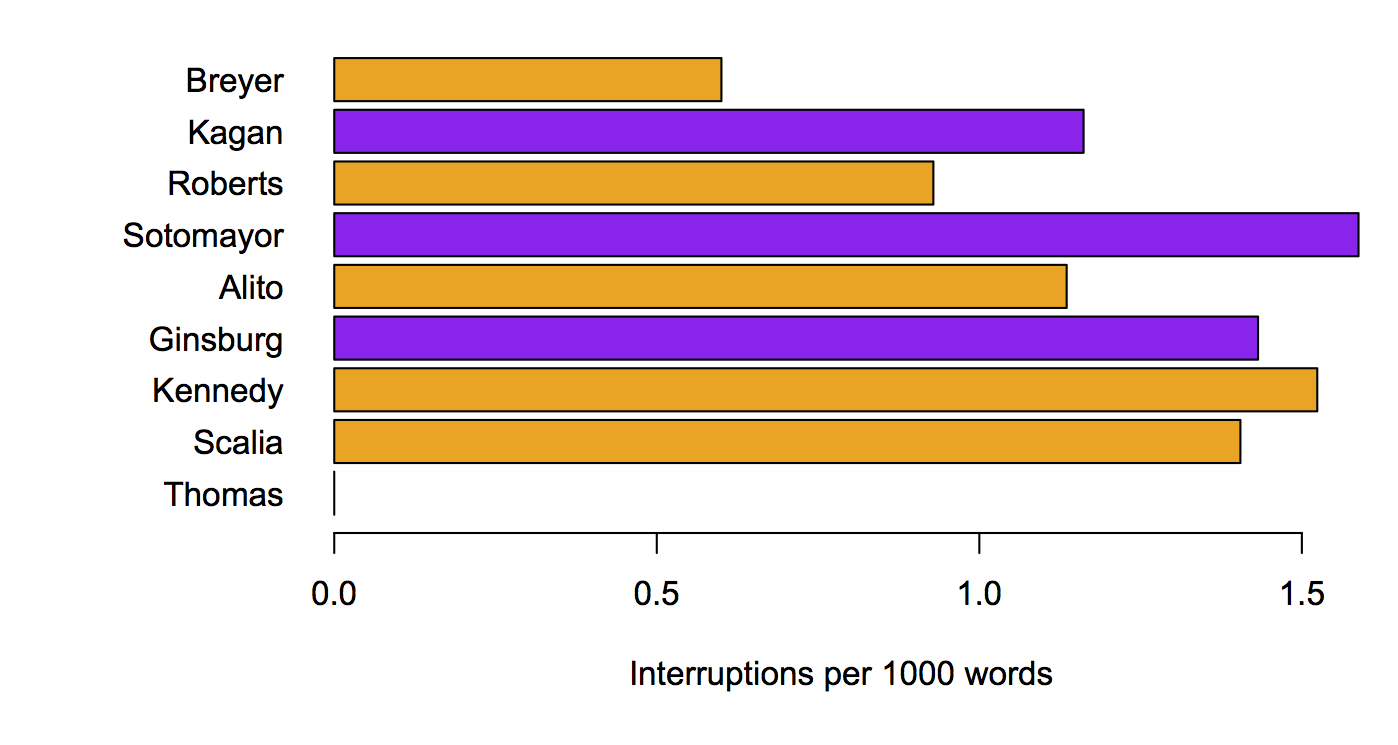
Here’s the number interruptions per 1000 words, with the judges sorted in order of  how much they speak

perword

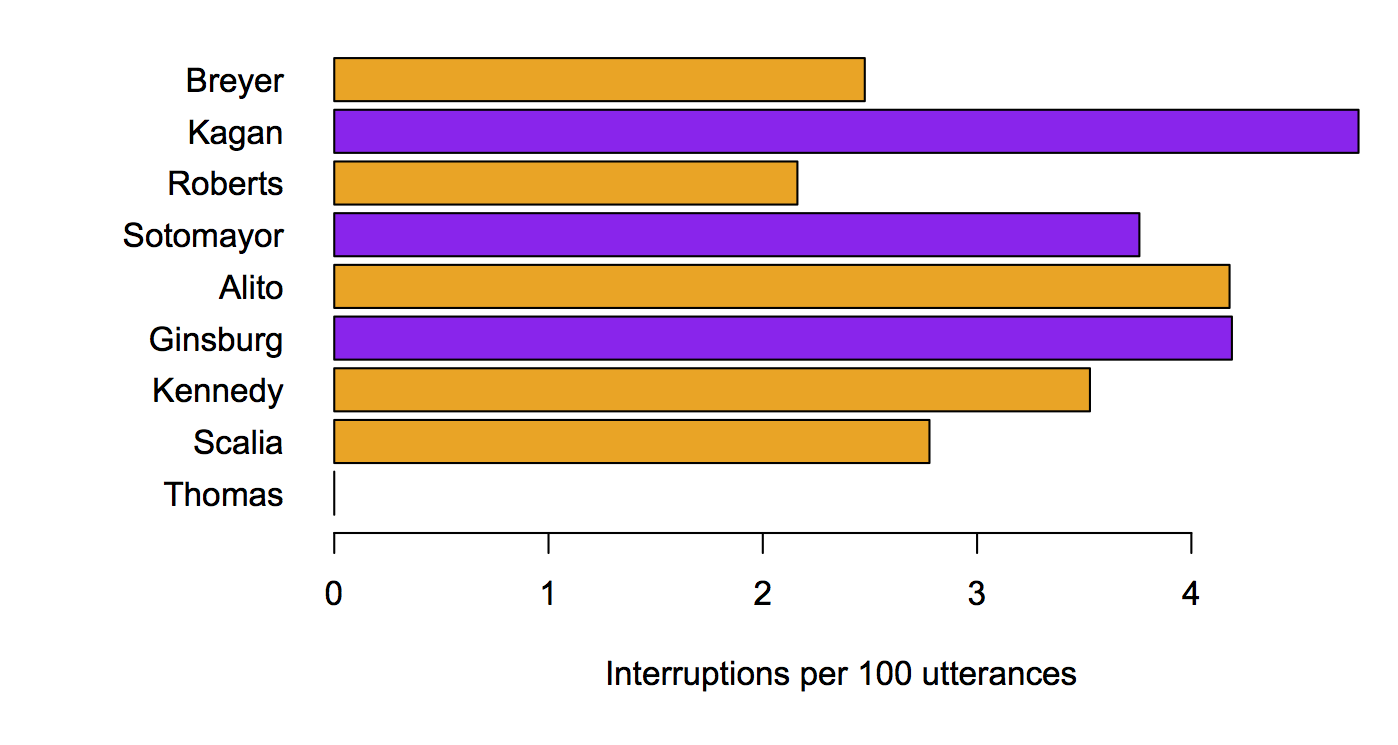
And here’s the same thing with interruption per 100 ‘utterances’

perutterance

It’s still pretty clear that the female judges are interrupted more often (yes, this is statistically significant (though not very)). Taking the amount of speech into account makes the differences smaller, but, interestingly, also shows that Ruth Bader Ginsburg is interrupted relatively often.

Denominators do matter.

April 28, 2016

Māori imprisonment statistics: not just age

Jarrod Gilbert had a piece in the Herald about prisons

Fifty per cent of the prison population is Maori. It’s a fact regularly cited in official documents, and from time to time it garners attention in the media. Given they make up 15 per cent of the population, it’s immediately clear that Maori incarceration is highly disproportionate, but it’s not until the numbers are given a greater examination that a more accurate perspective emerges.

The numbers seem dystopian, yet they very much reflect the realities of many Maori families and neighbourhoods.

to know what he was talking about, qualitatively. I mean, this isn’t David Brooks.

It turns out that while you can’t easily get data on ethnicity by age in the prison population, you can get data on age, and that this is enough to get a good idea of what’s going on, using what epidemiologists call “indirect standardisation”.

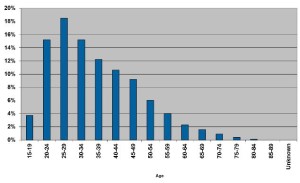
Actually, you can’t even easily get data on age, but you can get a graph of age:
ps_ages_3_16

and I resorted to software that reconstructs the numbers.

Next, I downloaded Māori population estimates by age and total population estimates by age from StatsNZ, for ages 15-84.  The definition of Māori won’t be exactly the same as in Dr Gilbert’s data. Also, the age groups aren’t quite right because we’d really like the age when the offence happened, not the current age.  The data still should be good enough to see how big the age bias is. In these age groups, 13.2% of the population is Māori by the StatsNZ population estimate definition.

We know what proportion of the prison population is in each age group, and we know what the population proportion of Māori is in each age group, so we can combine these to get the expected proportion of Māori in the prison population accounting for age differences. It’s 14.5%.  Now, 14.5% is higher than 13.2%, so the age-adjustment does make a difference, and in the expected direction, just not a very big difference.

We can also see what happens if we use the Māori population proportion from the next-younger five-year group, to allow for offences being committed further in the past. The expected proportion is then 15.3%, which again is higher than 13.2%, but not by very much. Accounting for age, it looks as though Māori are still more than three times as likely to be in prison as non-Māori.

You might then say there are lots of other variables to be looked at. But age is special.  If it turned out that Māori incarceration rates could be explained by poverty, that wouldn’t mean their treatment by society was fair, it would suggest that poverty was how it was unfair. If the rates could be explained by education, that wouldn’t mean their treatment by society was fair; it would suggest education was how it was unfair. But if the rates could be explained by age, that would suggest the system was fair. They can’t be.

April 27, 2016

Not just an illusion

There’s a headline in the IndependentIf you think more celebrities are dying young this year, you’re wrong – it’s just a trick of the mind“. And, in a sense, Ben Chu is right. In a much more important sense, he’s wrong.

He argues that there are more celebrities at risk now, which there are. He says a lot of these celebrities are older than we realise, which they are. He says that the number of celebrity deaths this year is within the scope of random variation looking at recent times, which may well be the case. But I don’t think that’s the question.

Usually, I’m taking the other side of this point. When there’s an especially good or especially bad weekend for road crashes, I say that it’s likely just random variation, and not evidence for speeding tolerances or unsafe tourists or breath alcohol levels. That’s because usually the question is whether the underlying process is changing: are the roads getting safer or more dangerous.

This time there isn’t really a serious question of whether karma, global warming, or spiders from Mars are killing off celebrities.  We know it must be a combination of understandable trends and bad luck that’s responsible.  But there really have been more celebrities dying this year.   Prince is really dead. Bowie is really dead. Victoria Wood, Patty Duke, Ronnie Corbett, Alan Rickman, Harper Lee — 2016 has actually happened this way,  it hasn’t been (to steal a line from Daniel Davies) just a particularly inaccurate observation of the underlying population and mortality patterns.