Posts from July 2013 (70)

July 31, 2013

NRL Predictions, Round 21

Team Ratings for Round 21

Here are the team ratings prior to Round 21, along with the ratings at the start of the season. I have created a brief description of the method I use for predicting rugby games. Go to my Department home page to see this.

Current Rating Rating at Season Start Difference
Roosters 11.71 -5.68 17.40
Rabbitohs 10.15 5.23 4.90
Sea Eagles 8.34 4.78 3.60
Bulldogs 5.42 7.33 -1.90
Knights 5.11 0.44 4.70
Storm 1.73 9.73 -8.00
Warriors -0.25 -10.01 9.80
Raiders -0.31 2.03 -2.30
Sharks -1.60 -1.78 0.20
Panthers -2.57 -6.58 4.00
Cowboys -2.87 7.05 -9.90
Broncos -4.69 -1.55 -3.10
Dragons -4.72 -0.33 -4.40
Titans -5.63 -1.85 -3.80
Wests Tigers -8.35 -3.71 -4.60
Eels -15.19 -8.82 -6.40


Performance So Far

So far there have been 144 matches played, 88 of which were correctly predicted, a success rate of 61.11%.

Here are the predictions for last week’s games.

Game Date Score Prediction Correct
1 Cowboys vs. Broncos Jul 26 16 – 18 8.40 FALSE
2 Bulldogs vs. Eels Jul 26 40 – 12 24.40 TRUE
3 Dragons vs. Raiders Jul 27 18 – 22 1.11 FALSE
4 Titans vs. Rabbitohs Jul 27 4 – 32 -7.11 TRUE
5 Warriors vs. Storm Jul 28 30 – 22 1.15 TRUE
6 Sharks vs. Panthers Jul 28 38 – 10 -0.16 FALSE
7 Knights vs. Roosters Jul 28 12 – 28 1.36 FALSE
8 Wests Tigers vs. Sea Eagles Jul 29 18 – 36 -10.74 TRUE


Predictions for Round 21

Here are the predictions for Round 21. The prediction is my estimated expected points difference with a positive margin being a win to the home team, and a negative margin a win to the away team.

Game Date Winner Prediction
1 Panthers vs. Roosters Aug 02 Roosters -9.80
2 Knights vs. Broncos Aug 02 Knights 14.30
3 Warriors vs. Sharks Aug 03 Warriors 5.80
4 Eels vs. Sea Eagles Aug 03 Sea Eagles -19.00
5 Cowboys vs. Rabbitohs Aug 03 Rabbitohs -8.50
6 Raiders vs. Storm Aug 04 Raiders 2.50
7 Titans vs. Wests Tigers Aug 04 Titans 7.20
8 Dragons vs. Bulldogs Aug 05 Bulldogs -5.60


Predictions for the Super Rugby Final

Team Ratings for the Super Rugby Final

This year the predictions have been slightly changed with the help of a student, Joshua Dale. The home ground advantage now is different when both teams are from the same country to when the teams are from different countries. The basic method is described on my Department home page.

Here are the team ratings prior to this week’s games, along with the ratings at the start of the season.

Current Rating Rating at Season Start Difference
Crusaders 9.78 9.03 0.80
Sharks 4.43 4.57 -0.10
Chiefs 4.02 6.98 -3.00
Stormers 3.99 3.34 0.70
Bulls 3.94 2.55 1.40
Brumbies 3.07 -1.06 4.10
Waratahs 1.15 -4.10 5.30
Reds -0.70 0.46 -1.20
Cheetahs -1.16 -4.16 3.00
Hurricanes -2.28 4.40 -6.70
Blues -3.22 -3.02 -0.20
Highlanders -5.85 -3.41 -2.40
Force -7.69 -9.73 2.00
Rebels -8.66 -10.64 2.00
Kings -15.61 -10.00 -5.60


Performance So Far

So far there have been 124 matches played, 85 of which were correctly predicted, a success rate of 68.5%.

Here are the predictions for last week’s games.

Game Date Score Prediction Correct
1 Chiefs vs. Crusaders Jul 26 20 – 19 -4.10 FALSE
2 Bulls vs. Brumbies Jul 27 23 – 26 6.40 FALSE


Predictions for the Super Rugby Final

Here are the predictions for the Super Rugby Final. The prediction is my estimated expected points difference with a positive margin being a win to the home team, and a negative margin a win to the away team.

Game Date Winner Prediction
1 Chiefs vs. Brumbies Aug 03 Chiefs 5.00


It depends on how you look at it

Collapsing lots of variables into a single ‘goodness’ score always involves choices about how to weight different information; there isn’t a well-defined and objective answer to questions like “what’s the best rugby team in the world?” or “what’s the best university in the world?”.  And if you put together a ranking of rugby teams and ended up with Samoa at the top and the All Blacks well down the list, you might want to reconsider your scoring system.

On the other hand, it’s not a good look if you make a big deal of holding failing schools accountable and then reorder your scoring system to move a school from “C” to “A”. Especially when it’s a charter school founded by a major donor to the governing political party.

Emails obtained by The Associated Press show Bennett and his staff scrambled last fall to ensure influential donor Christel DeHaan’s school received an “A,” despite poor test scores in algebra that initially earned it a “C.”

“They need to understand that anything less than an A for Christel House compromises all of our accountability work,” Bennett wrote in a Sept. 12 email to then-chief of staff Heather Neal, who is now Gov. Mike Pence’s chief lobbyist.


“10 quadrillion times more likely to have done it”

Thomas Lumley, tipped off by Luis Apiolaza on Twitter, pointed me to this article in the NZ Herald.

The article is yet another example of the Herald’s inability to correctly report DNA statistics. It makes the following statement:
This article reports a quote from the Crown Prosecutor, paraphrased as follows:

A man charged with raping a woman during a kidnap has pleaded not guilty but Crown says DNA evidence shows the man was “10,000,000,000,000,000 times likely” to be responsible for the crime.

To be fair to the article’s author, this may have been the statement that the Crown prosecutor made, but nNo forensic scientist in New Zealand would say this. ESR scientists are trained to give statements of the following type:

“The evidence is 1016 (=10,000,000,000,000,000) times more likely if the defendant and the victim were contributors to the stain, rather than the victim and someone unrelated to the defendant.”

It is extremely important to note that This is a statement about the likelihood of the evidence given the hypotheses rather than the other way around. A forensic scientist is bought to court to comment on the strength of the evidence and specifically not on whether the defendant is guilty.

I have commented on this before., and sent correspondence to the NZ Herald numerous times. Perhaps a mention on StatsChat will inspire change.

Update: The NZ Herald reporter, James Ihaka, has contacted me and said “The statement came from a Crown prosecutor about the evidence that the forensic scientist will present later in the trial. Taking in to consideration what you have said however, it would probably be more accurate to rephrase this.” Good on you James!

Update 2: James Ihaka has contacted me again, with the following information:

This is the direct quote from Crown prosecutor Rebecca Mann: ( I checked with her)
“It is ten thousand million million times more likely for the DNA these samples originated from (the complainant) and Mr Martin rather than from (the complainant) and another unrelated individual selected at random from the general New Zealand population.”

I apologize unreservedly for attributing this to James Ihaka, and again congratulate him for following it up.

The statement Ms. Mann should have given is


The evidence (the DNA match) is ten thousand million million times more likely if these samples originated from (the complainant) and Mr Martin rather than if they originated from (the complainant) and another unrelated individual selected at random from the general New Zealand population.”

July 30, 2013

Always ask for the margin of error

The Herald now has picked up this morning’s UK story from the London Fire Brigade, that calls from people handcuffed or otherwise stuck in embarassing circumstances are on the rise.  The Fire Brigade only said

“I don’t know whether it’s the Fifty Shades effect, but the number of incidents involving items like handcuffs seems to have gone up.

The Herald has the relatively sedate headline “‘Fifty Shades of Grey effect’ plagues London“, but the British papers go further (as usual).   For example, the Mirror’s headline was “Fifty Shades of Grey sex leads to soaring 999 calls“.  This is the sort of story that’s too good to check, so no-one seems to have asked how much evidence there is of an increase.

The actual numbers quoted by the fire brigade for calls to people stuck in what could loosely be called household items were: 416 in 2010/11, 441 in 2011/12, and 453in 2012/13. If you get out your Poisson distribution and do some computations, it turns out this is well within the expected random variation — for example the p-value for a test of trend is 0.22 (or for the Bayesians, the likelihood ratio is also very unimpressive). Much more shades of grey than black and white.

So, if you don’t have hot and cold running statisticians at your newspaper, how can you check this sort of thing?  There’s a simple trick for the margin of error for a count of things on a hand calculator: take the square root, add and subtract 1 to get upper and lower  limits, then square them again.  Conveniently, in this case, 441 is exactly 21 squared, so an uncertainty interval around the 441 value would go from 20 squared (400) to 22 squared (484).


3d bar graphs: just say no.

Or perhaps “OMG NO!!!”

article-3178

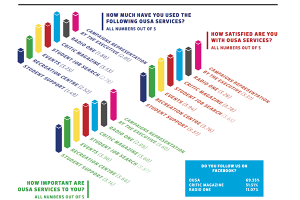
This example (click to embiggen) comes from The Critic, the magazine of Otago University Students Association and has been nominated for Stat of the Week.  It accompanies a reasonable story about satisfaction with services provided by OUSA.   There are some good points: for example, the colour coding means that you can easily tell which bars in the three graphs refer to the same OUSA service.  What you can’t easily do is compare services for levels of satisfaction. For example, in the right-hand set of bars, is the magenta bar taller than, shorter than, or the same as the  dark blue bar? Are you sure? How about the light blue and green bars? Also, if the questions were on a 1 to 5 scale, the bars should start at one, not at zero.

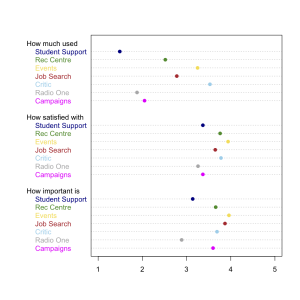
Here’s a version that’s less pretty but actually lets you compare the numeric values. I kept the same colour-coding, although more sedate colours would have been easier to read

ousa-survey


Transit maps: moving further from geography

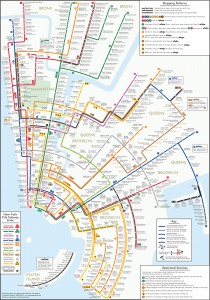
The famous London Transport map showed that a train map didn’t have to represent where the trains went, just how they related to each other.  A new example from New York uses concentric circles. The designer says

 “These circles maps score poorly for simplicity: the line trajectories have lots of twists and turns, but score well for coherence: the city is forced into an unprecedented level of organization

1682692-inline-1200svpq


(via @juhasaarinen)

July 29, 2013

Stat of the Week Competition: July 27 – August 2 2013

Each week, we would like to invite readers of Stats Chat to submit nominations for our Stat of the Week competition and be in with the chance to win an iTunes voucher.

Here’s how it works:

  • Anyone may add a comment on this post to nominate their Stat of the Week candidate before midday Friday August 2 2013.
  • Statistics can be bad, exemplary or fascinating.
  • The statistic must be in the NZ media during the period of July 27 – August 2 2013 inclusive.
  • Quote the statistic, when and where it was published and tell us why it should be our Stat of the Week.

Next Monday at midday we’ll announce the winner of this week’s Stat of the Week competition, and start a new one.

(more…)

Stat of the Week Competition Discussion: July 27 – August 2 2013

If you’d like to comment on or debate any of this week’s Stat of the Week nominations, please do so below!

July 28, 2013

Briefly

  • “Drawing conclusions from data”: a lecture and examples from Jonathan Stray at a Science Immersion Workshop for journalists
  • Why we believe stuff — in this case high-dose vitamins.  Paul Offit in the Atlantic blames it mostly on Linus Pauling
  • Using Big Data to oppress a subset of the population (vampires, via Keith Ng)
  • A Herald story on meth-lab damage mentioned meth alarms, which are apparently a thing. The vendor’s website says “A silent alarm system guaranteed to detect the manufacture of methamphetamine (‘P’) in your property.” That could be valuable, but unfortunately there’s no information given on the false positive or false negative error rates, and if you read the detailed terms and conditions, the alarm system doesn’t actually seem to be guaranteed to do anything except bill you monthly.