Anybody for a slice of PISA?
There has been significant coverage in the press of New Zealand’s slip in the OECD PISA (Programme for International Student Assessment) rankings for mathematics, reading, and science.
We probably should be concerned.
However, today I stumbled across the following chart: 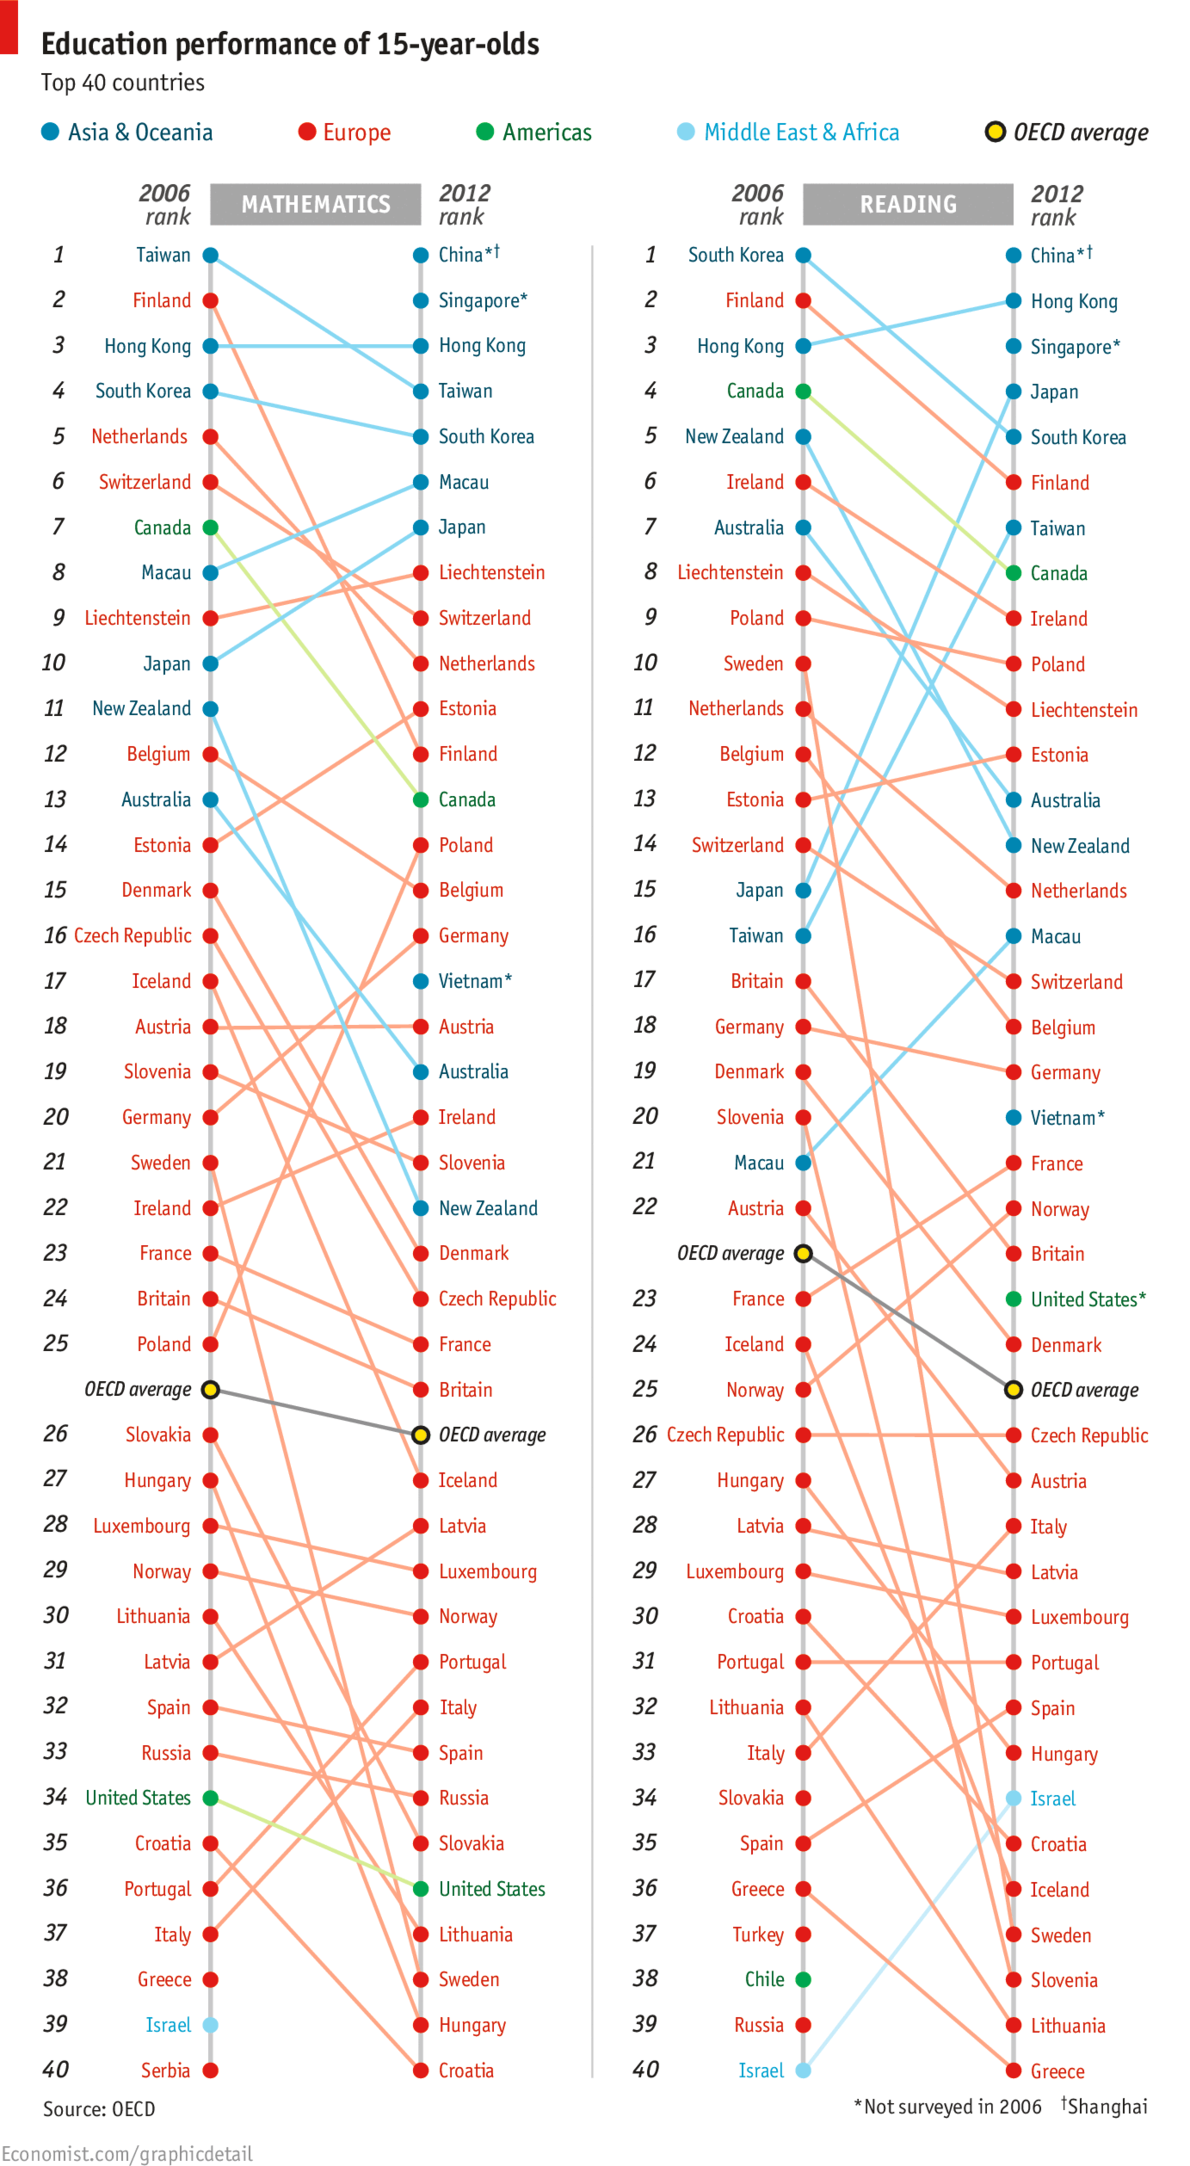 in The Economist. Two things about it struck me. Firstly, part of the change (in the mathematics ranking at least) was driven by the addition of three countries/cities which did not participate in the 2006 round: Shanghai, Singapore, and Vietnam. The insertion of these countries is not enough to explain away New Zealand’s apparent drop, but it does move us from a change of down 11 places to a change of down 8 places. Secondly, I found it really hard to see what was going on in this graph. The colour coding does not help, because it reflects geographic location and the data is not grouped on this variable. Most of the emphasis is probably initially on the current ranking which one can easily see by just reading the right-hand ranked list from The Economist’s graphic. However, relative change is less easily discerned. It seems sensible, to me at least, to have a nice graphic that shows the changes as well. So here it is, again just for the mathematics ranking:
 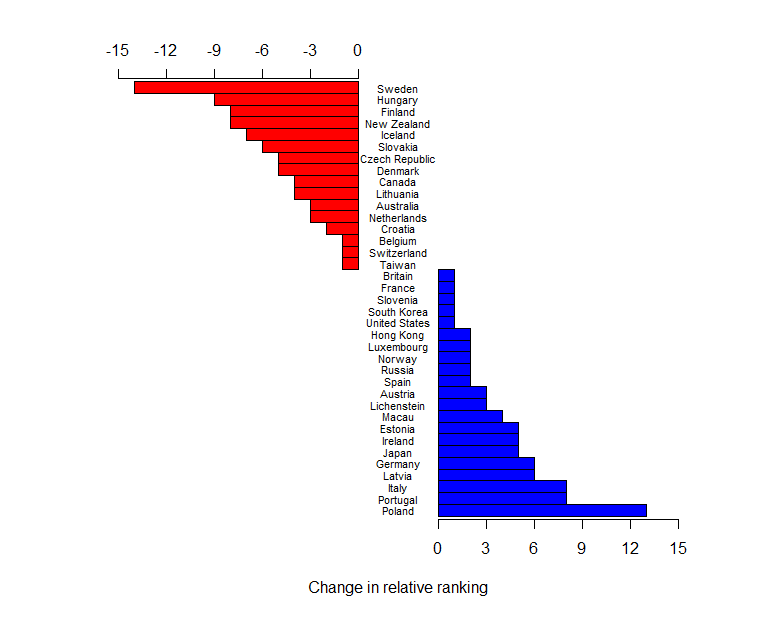 .
.
The raw data (entered by me from the graph) has been re-ranked omitting Greece, Israel, and Serbia who did not participate in 2012, and China, Singapore, and Vietnam, who did not participate in 2006. I am happy to supply the R script to anyone who wants to change the spacing – I have run out of interest.
It is also worth noting that these rankings are done on mean scores of samples of pupils. PISA’s own reports have groups of populations that cannot be declared statistically significantly different (if you like to believe in such tests). This may also change the rankings.
Updates:
Professor Neville Davies, Director of the Royal Statistical Society’s Centre for Statistical Education, and Elliot Lawes, kindly sent me the following links:
Firstly a blog article from the ever-thoughtful Professor David Spiegelhalter: The problems with PISA statistical methods
and secondly, a couple of articles from the Listener, which I believe Julie Middleton has also mentioned in the comments:
Education rankings “flawed” by Catherine Woulfe” and Q&A with Andreas Schieicher also by Catherine Woulfe.
James Curran's interests are in statistical problems in forensic science. He consults with forensic agencies in New Zealand, Australia, the United Kingdom, and the United States. He produces and maintains expert systems software for the interpretation of evidence. He has experience as an expert witness in DNA and glass evidence, appearing in courts in the United States and Australia. He has very strong interests in statistical computing, and in automation projects. See all posts by James Curran »
Isn’t out fault (statisticians that is) that the maths scores have gone down? My understanding is that a state of the art stats curriculum has been introduced into schools (which I assume is at the expense of pure maths). And it shows in our scores i.e. our scores were high on the stats questions and low on the pure maths questions.
If the test covers stuff we haven’t taught and doesn’t cover stuff that is taught here, stuff that we obviously value, does it even make sense to make comparisons between countries?
13 years ago
Hi Megan,
I’m not sure I’m qualified to respond. I will ask our education gurus to chip in
13 years ago
The latest Listener (in subscribers’ letterboxes today) has a major feature on PISA – and it would seem that the sample isn’t what it could be: German sociologist Joerg Blaus from the university of Bonn has been investigating “impression management” in PISA, and says schools that are asked to take part can decline, and schools that do choose to take part can ‘de-select’ students who are not performing well. The feature is well worth a read.
13 years ago
There are many issues (both statistical issues and communication issues) associated with the PISA study.
The OECD puts undue emphasis on the rankings and, in my opinion, fails to communicate any of the associated interpretation issues (see James’ points above).
Comparing mean scale scores and distributions etc is better, but in order to use these you really have to buy the psychometric model behind the generation of the scale scores.
In particular, you have to buy that the model works the same across a whole pile of different countries and languages.
I haven’t run Differential Item Function tests on this data, but I find it quite a stretch to believe that this level of invariance exists.
Then there are other contextual factors when interpreting the data: what is the assessment culture in country X, are the 15-year-olds that are in school in country X _really_ the same that are in country Y? etc etc.
There are other issues associated with imputation also.
That is not to say that PISA is no good. Certainly, in New Zealand the data collection process is highly rigorous and the collected data can provide valuable insight into the education and skills of 15-year-olds in this country.
The multiple country aspect of PISA is also not necessarily bad, but could be re-framed as a way to share development costs (which can be extensive for an assessment like this) for within-country analysis rather than as a way to obtain an international comparison.
There are some good critiques out there (eg http://www.statslife.org.uk/opinion/1074-the-problems-with-pisa-statistical-methods ) as well as the usual rubbish you find on the interwebs.
13 years ago