Weight gain lie factor
From Malaysian newspaper The Star, via Twitter, an infographic that gets the wrong details right
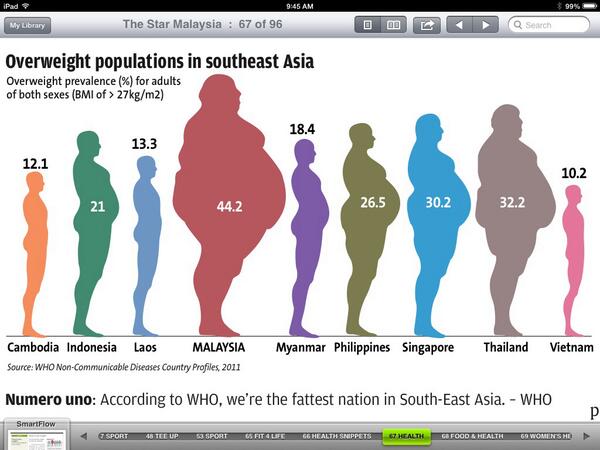
The designer went to substantial effort to make the area of each figure proportional to the number displayed (it says something about modern statistical computing that the my quickest way to check this was read the image file in R, use cluster analysis to find the figures, then tabulate).
However, it’s not remotely true that typical Malaysians weigh nearly four times as much as typical Cambodians. The number is the proportion above a certain BMI threshold, and that changes quite fast as mean weight increases. Using 1971 US figures for the variability of BMI, you’d get this sort of range of proportion overweight with a 23% range in mean weight between the highest and lowest countries.
Thomas Lumley (@tslumley) is Professor of Biostatistics at the University of Auckland. His research interests include semiparametric models, survey sampling, statistical computing, foundations of statistics, and whatever methodological problems his medical collaborators come up with. He also blogs at Biased and Inefficient See all posts by Thomas Lumley »
Hi Thomas, getting data from a chart image is something I occasionally need to do.
So rather than breaking out the ruler next time; would you mind sharing the code you’ve used to do the cluster analysis?
I’m familiar with bwlabel from EBImage, but it seems you’re doing something a little more sophisticated than segmenting.
Cheers.
12 years ago
I used the “png” package in R to read in a PNG version of the image, then clara() [partitioning around medoids for large data] from the “cluster” package to generate the clusters, then table() to count pixels in each cluster. This separates them by colour.
It helped that I didn’t need all the clusters to separate out cleanly, just enough of them to check the scaling.
12 years ago
Nice!
I was unaware you could use clara() on an image and getting completely lost in the Medical Imaging task view; thanks for the pointer.
12 years ago
I knew about it because I did the same clustering to some of the Ishihara colour-blindness test plates (PDF pp4-8)
12 years ago