Crushing and crashing
The Herald says “Police Minister Judith Collins has released figures to show crushing boy racers’ cars has worked“. The data are more consistent with the political interpretation than is usual for claims about crashes, but not as strong as the Minister would like us to think.
Here’s a graph of the data (supplied to the Herald by the Minister’s office), showing crashes, injuries, and deaths where the police reported ‘racing’ as a cause:
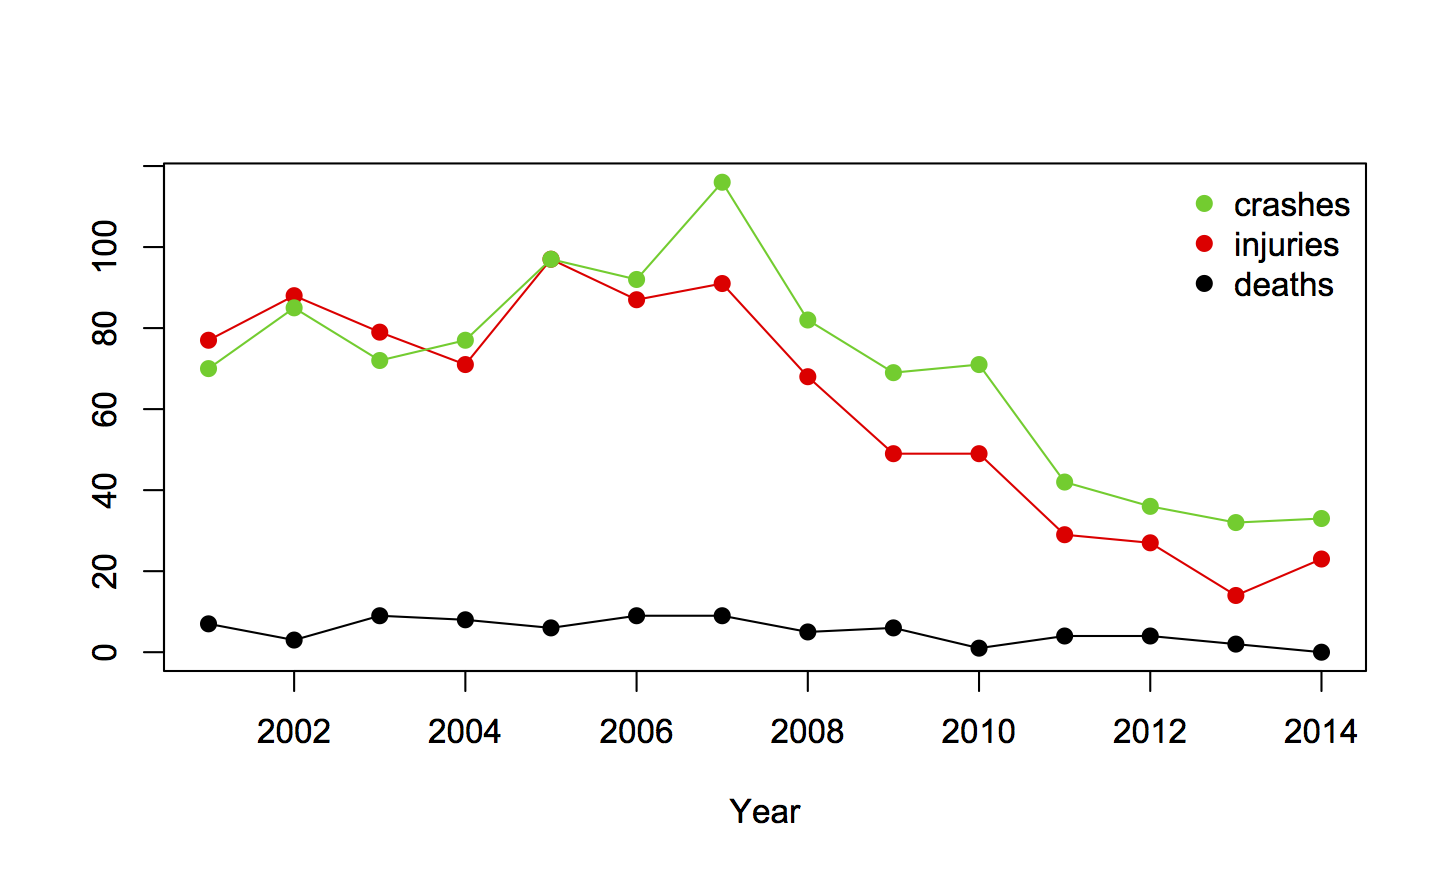
It’s fairly clear that something changed. Based purely on the graph you’d say the downwards trend started after 2007; 2009 isn’t unreasonable, but it fits the data a bit less well. This an example of a graph being much more useful than a table.
The next thing to check is other crashes — the road toll has been down in recent years, so this could just have been a general improvement. It’s not; the evidence for a change is a little weaker when considering racing deaths or injuries as a proportion of all fatal or injury crashes, but it’s still there.
In principle there could have been changes in reporting, but it’s hard to see how a government crackdown would make police less likely to report ‘racing’ involvement in a crash.
Finally, there’s publication bias. The reporter, Nicholas Jones, didn’t notice that Ms Collins was back and decide to pull figures on car crushing; the Minister decided to release the figures. She wouldn’t have done that if they didn’t look favourable. It’s hard to tell how much to discount the evidence for that, but a discount is needed.
Overall, the data are definitely consistent with a deterrent effect of car crushing, but the evidence isn’t all that strong — the best fit to the data suggests things changed earlier than 2009, and looking at the numbers was the Minister’s idea, not the reporter’s.
Updates:
- in addition to the useful comments, I’ve been pointed to Dog & Lemon where Clive Matthew-Wilson says there is reason to believe the ‘boy racer’ thing was already going away on its own. If so, that would fit the trend starting earlier than the legislation.
- If you check the crash numbers against the Road Crash Statistics system they don’t match. I think that’s because Table 26 of the Road Crash Statistics only includes crashes causing injury or death — that’s explicit in the 2012 spreadsheet, and I think it’s still true.
Thomas Lumley (@tslumley) is Professor of Biostatistics at the University of Auckland. His research interests include semiparametric models, survey sampling, statistical computing, foundations of statistics, and whatever methodological problems his medical collaborators come up with. He also blogs at Biased and Inefficient See all posts by Thomas Lumley »
It would be good to see Chch’s data separated out as Chch was notorious for boy racers … but it’s hard to be a boy racer when the road are impassable.
10 years ago
Yes, it would be nice, and if the trend had changed after the quakes it would have been vital.
10 years ago
When looking at this I did come across some regional data
https://thoughtfulbloke.wordpress.com/2016/02/22/speed-bumps/
The short answer is the earthquake does not seem to have influenced speeding behaviour.
10 years ago
You could throw real petrol prices in as well, with a 20%-ish change over the period. Figure 24, page 28, http://www.transport.govt.nz/assets/Uploads/Our-Work/Documents/fd-trends-and-projections.pdf
10 years ago
The other thing is that when the economy tanks, younger people delay getting their licenses because they don’t have the money and won’t have a car to use. It would be interesting to see the number and proportion of 18-24 year olds (separated out by gender) with car driver licenses over the same time period.
10 years ago
Just taking another approach to Megan’s suggestion of affordability-
Glancing at a quick graph of median 20-24 year old male income for the period (from NZ.Stat), and inflation adjusting it for CPI (from InfoShare), the 20% drop in real income from 2008 to 2010 could be contributing to affordability of racing and so the amount of racing and crashes (and keeping in mind the 20% increase in the real cost of petrol through the period)
10 years ago
Finding that the number of speed demerit incidences (by Camera or Police Officer) from the Police website rose 2009-2010, was flat 2010-2013, and rose 2013-2014, that means that racing crashes were decreasing while speeds have not been affected. Which kind of suggests people might still be speeding, just not crashing.
10 years ago