August 15, 2016
Graph of the week
From a real estate agent who will remain nameless
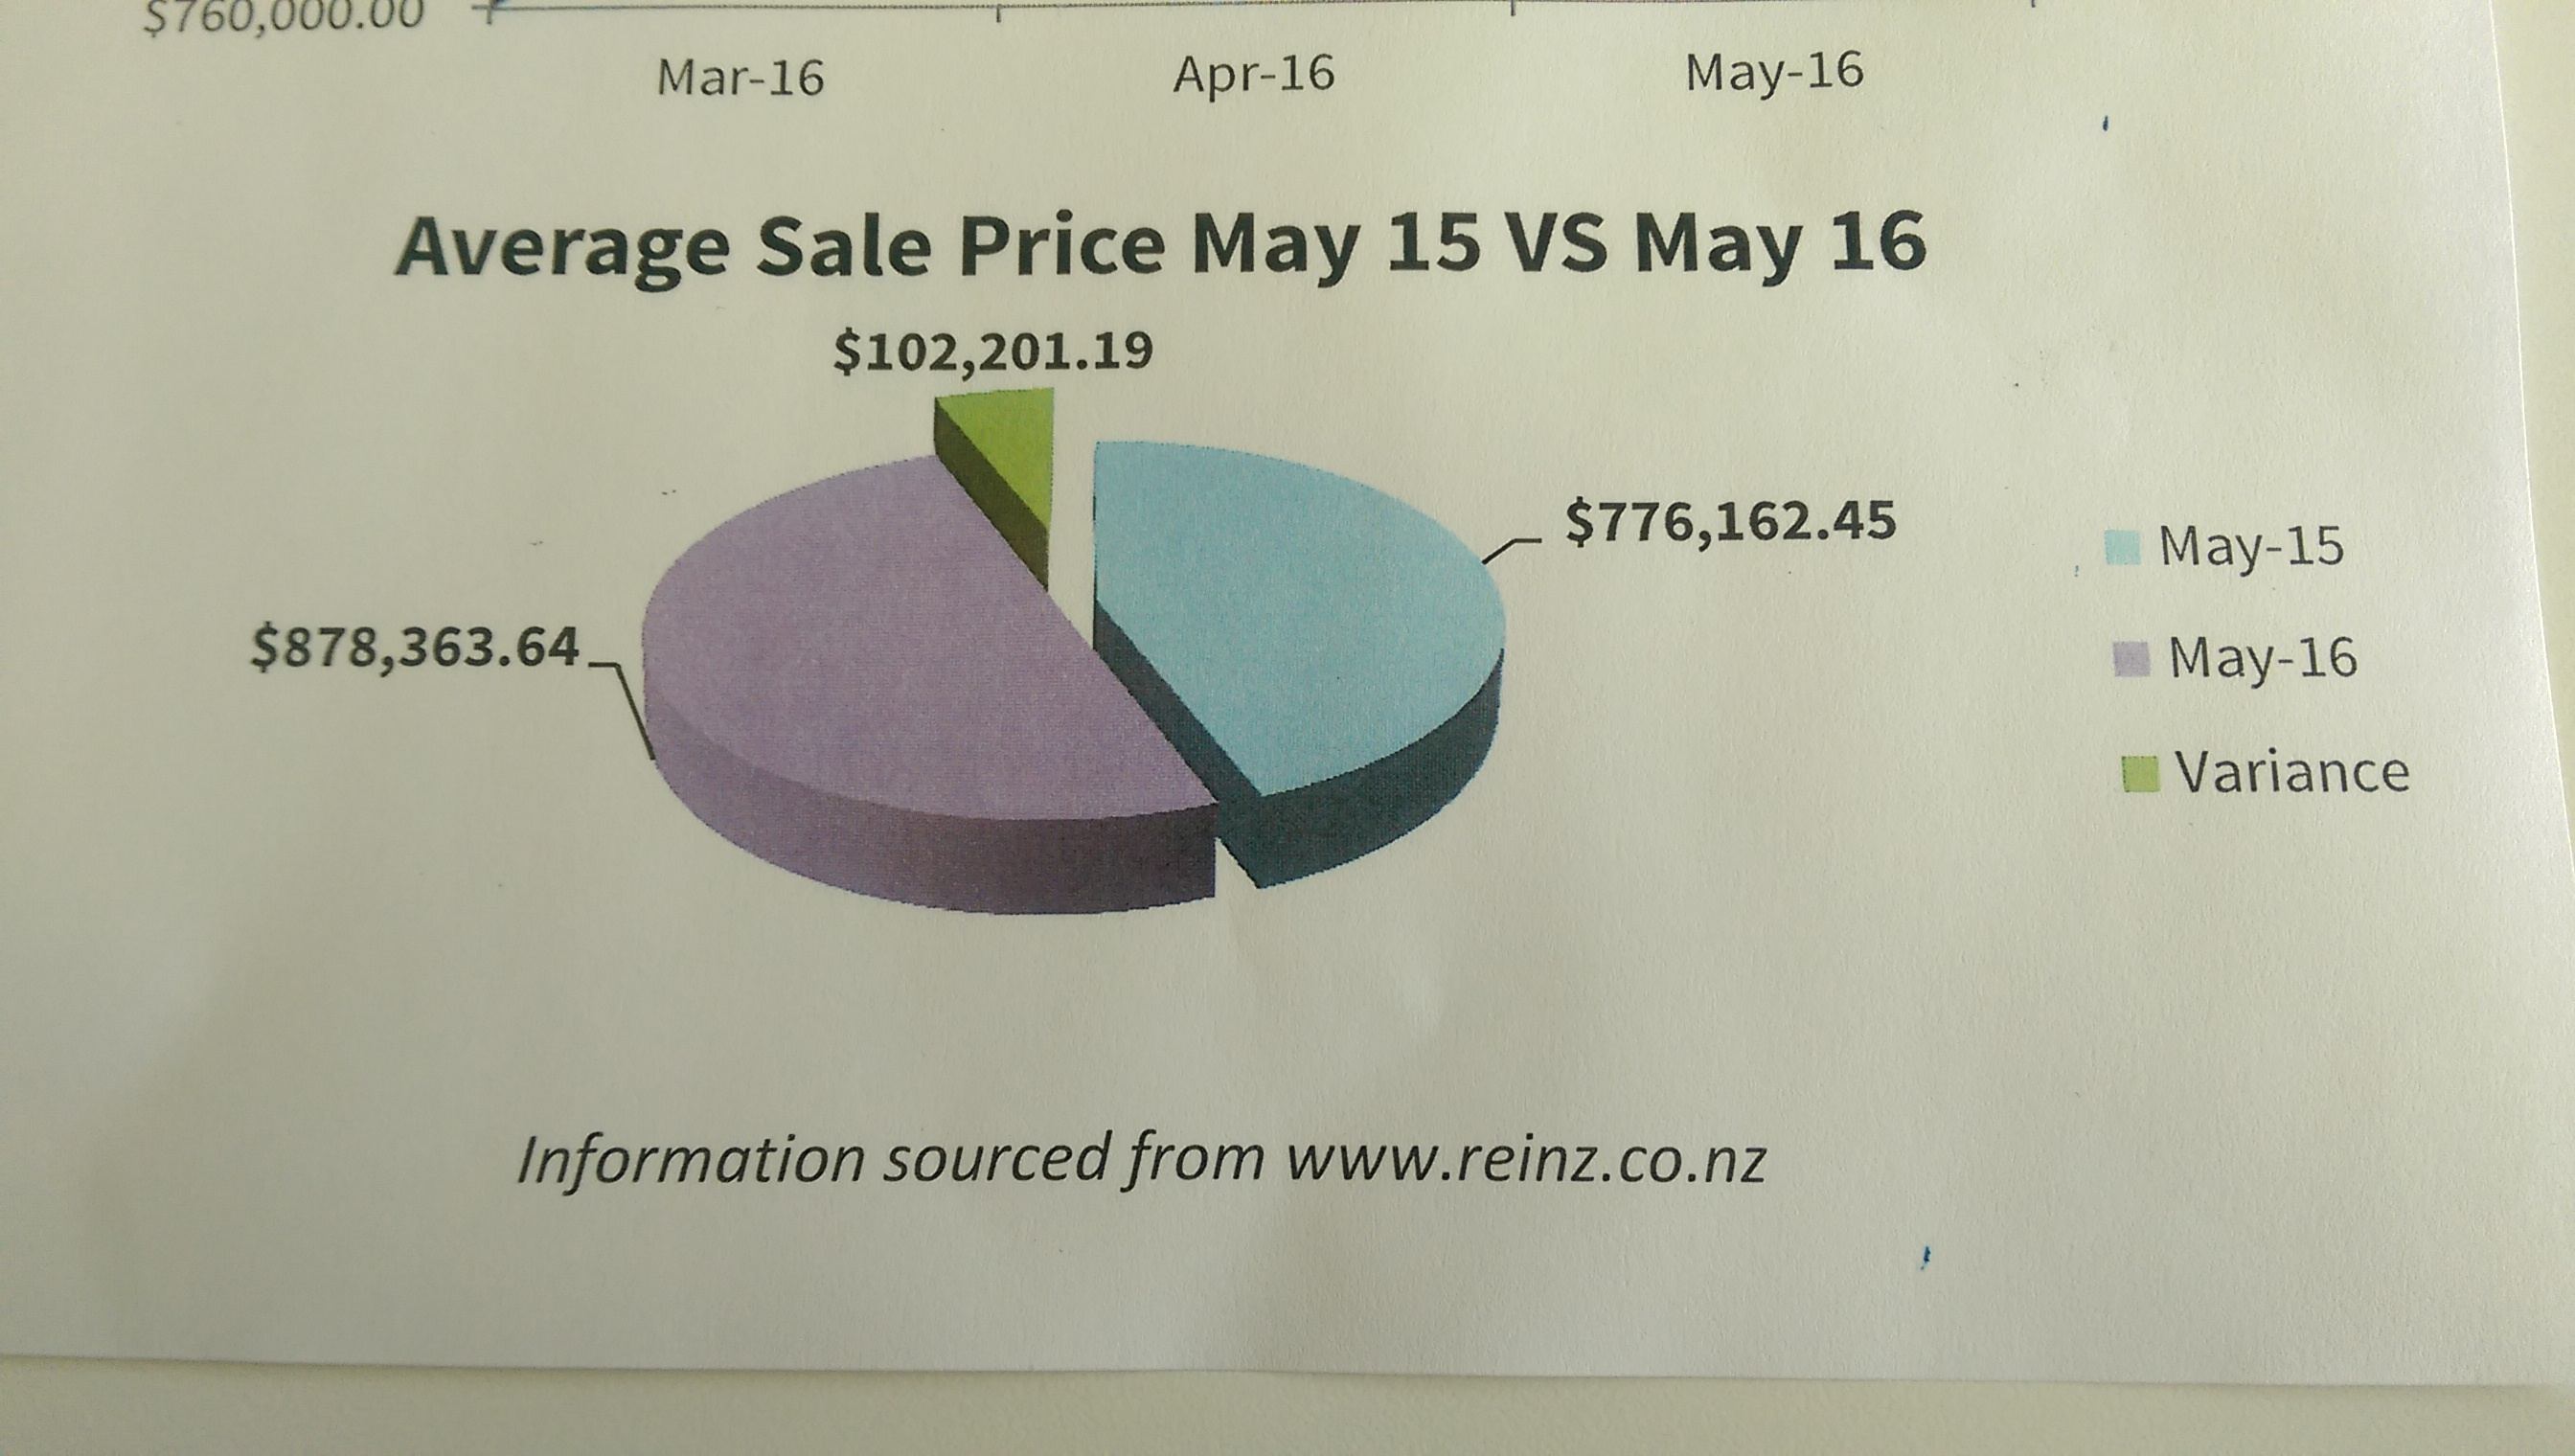
Another example of the rule ‘if you have to write out all the numbers, the graph isn’t doing its work.”
Thomas Lumley (@tslumley) is Professor of Biostatistics at the University of Auckland. His research interests include semiparametric models, survey sampling, statistical computing, foundations of statistics, and whatever methodological problems his medical collaborators come up with. He also blogs at Biased and Inefficient See all posts by Thomas Lumley »
Average sale prices 1 day apart ? Do they mean 1 year ?
10 years ago
I believe they mean a year apart.
10 years ago
Pie charts are a poor choice most of the time, but this one is awful. It fails on just about every measure.
10 years ago
It’s Hall of Fame worthy.
10 years ago
It even records the cents!
10 years ago
Yes, that was a nice touch.
10 years ago